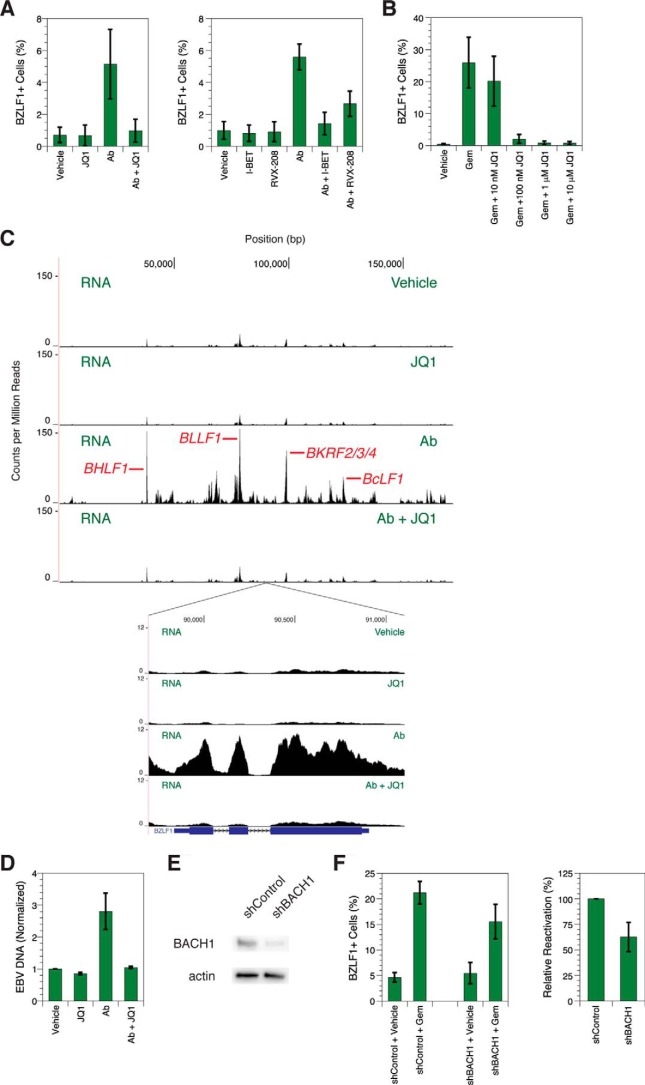
Figure 2.
BET inhibitors suppress BZLF1 expression. A, flow cytometry analysis of BZLF1 staining in MutuI cells treated with antibody (Ab). Error bars show the standard deviation of n = 8 (left) or n = 4 (right) replicates. B, flow cytometry of BZLF1 staining in MutuI cells treated with gemcitabine (Gem). Error bars show the standard deviation of n = 4 replicates. C, RNA-seq profiles of treated MutuI cells showing the entire EBV genome (top) or the region containing the BZLF1 gene (inset). Axes denote genomic position in base pairs and counts per million mapped reads. Some major peaks corresponding to lytic gene expression are labeled. Below the inset, the BZLF1 gene is shown in schematic form where blocks represent exons and lines with arrows represent introns. Results are representative of three independent biological replicates. D, -fold change in EBV DNA from treated MutuI cells based on deep sequencing of chromatin. EBV content was calculated as a percentage of total sequenced DNA, and for each set, EBV DNA percentage was normalized to that in the vehicle-treated sample. Error bars represent the standard deviation of n = 3 replicates. E, Western blots of BACH1 expression levels in MutuI cells after shRNA-mediated knockdown. β-Actin expression levels are shown as normalization controls. F, flow cytometry of BZLF1 staining in MutuI cells treated with gemcitabine during BACH1 knockdown. Relative reactivation is calculated as the increase in BZLF1-positive cell percentage relative to the control. Error bars show the standard deviation of n = 5 replicates.

