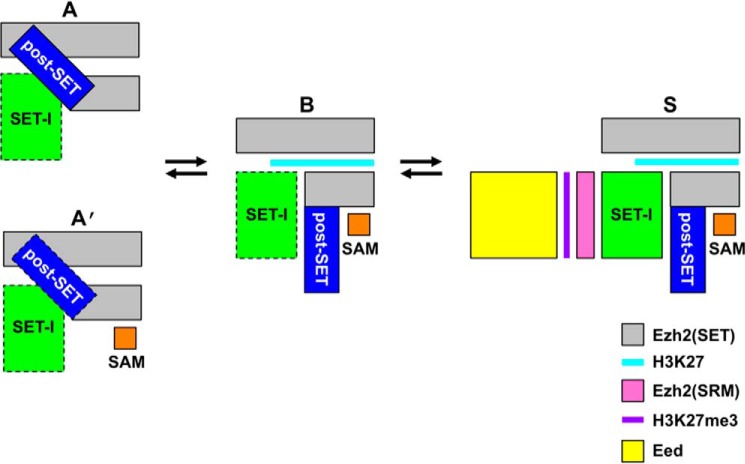
Figure 5.
Schematic of the different stable conformational states of ctPRC2. Letter codes correspond to autoinhibited (A); SAM-bound, autoinhibited (A′), basal (B), and H3K27me3-stimulated (S) states based on the observed structural transitions of ctPRC2. A dotted black box indicates a destabilized conformation compared with that in a neighboring structural state. Note that although all the structural transitions are based on a minimally active PRC2 complex (i.e. Ezh2–Eed–Suz12(VEFS)), Suz12(VEFS) is omitted from all the schematics, and Eed is only shown in the S state for clarity. SRM, stimulation-responsive motif.

