Figure 4.
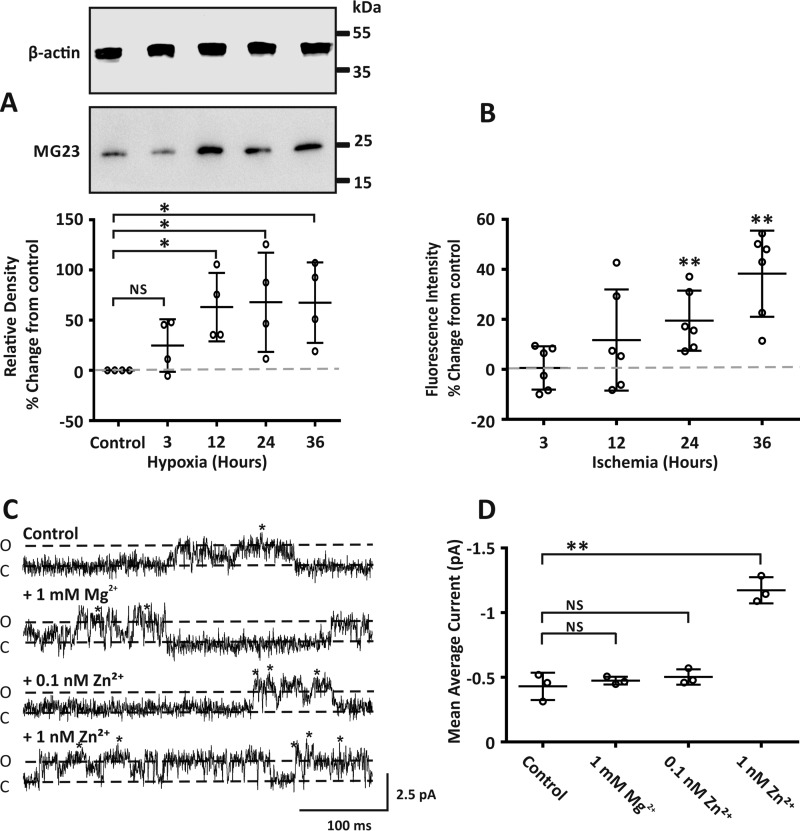
Pathophysiological concentrations of Zn2+ altered both the expression and activity of MG23. A, the upper panel representative Western blot shows MG23 protein expression in H9C2 cells exposed to hypoxia. All lanes were loaded with 10 μg of total protein. Western blots were probed with antibodies specific for MG23 or with β-actin as a loading control. Size markers are indicated in kDa. The lower panel scatter plot shows relative density of MG23 under labeled conditions. Band densities were normalized to β-actin loading controls in each lane and are expressed relative to control as % percentage change. The gray dashed line denotes control values. Data are displayed as the mean ± S.D. (n = 4). * denotes a significant difference (p < 0.05) to control. B, scatter plot showing ZnAF-2 DA fluorescence intensity from H9C2 cells exposed to ischemia buffer for indicated time points. For each time point ZnAF-2 DA fluorescence was normalized to DAPI nuclear staining fluorescence intensity for each corresponding well and expressed as percentage change from control. Control values are indicated by the gray dotted line. Data are displayed as the mean ± S.D. (n = 6) from two individual cell preparations. ** denotes a significant difference (p < 0.01) to control. C, MG23 single-current fluctuations show increased channel activity with increasing concentrations of cytosolic Zn2+, in the presence of physiological levels (1 mm) Mg2+. The traces were chosen to show clear channel openings. Cytosolic free Ca2+ was 5 μm. Open (O) and closed (C) states are indicated. Holding potential was 0 mV, and Ca2+ was used as the permeant ion. Multiple MG23 often incorporated into the bilayer, indicated by *. D, scatter plot showing the mean average current under conditions described in C. Data are displayed as the mean ± S.D. (n = 3). ** indicates a significant difference (p < 0.01) to control. NS, not significant.

