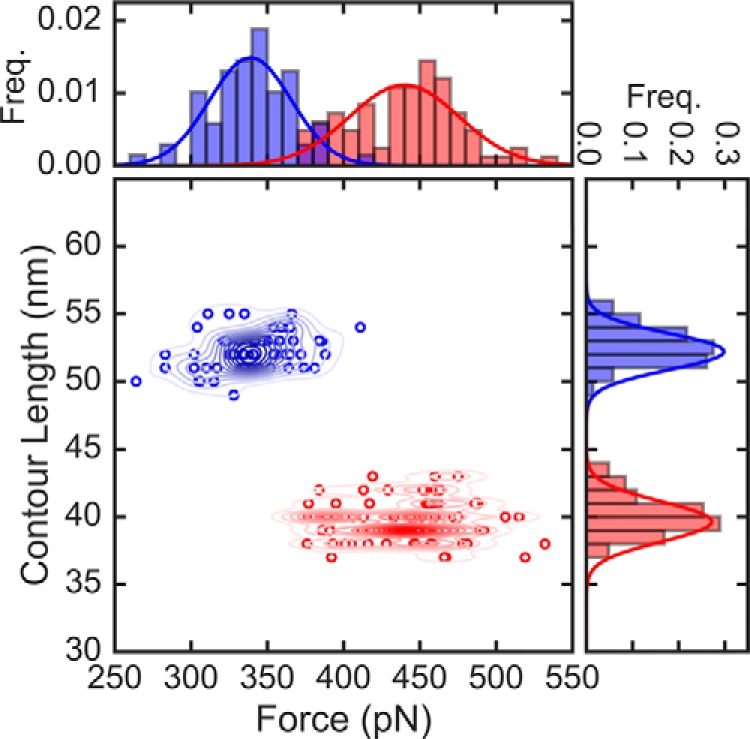
Figure 2.

Unfolding forces and contour lengths of FimG from constant force pulling. Scatter plot of force versus contour length with corresponding histograms (top and right, respectively) of the self-complemented FimG. The total number of data points are n = 83 and 69 for oxidized domains and reduced domains, respectively. Lines in the histograms are Gaussian fits to the data. The red and blue colors denote the oxidized and reduced states, respectively. Contour lines in the scatter plot were generated using kernel density estimates.
