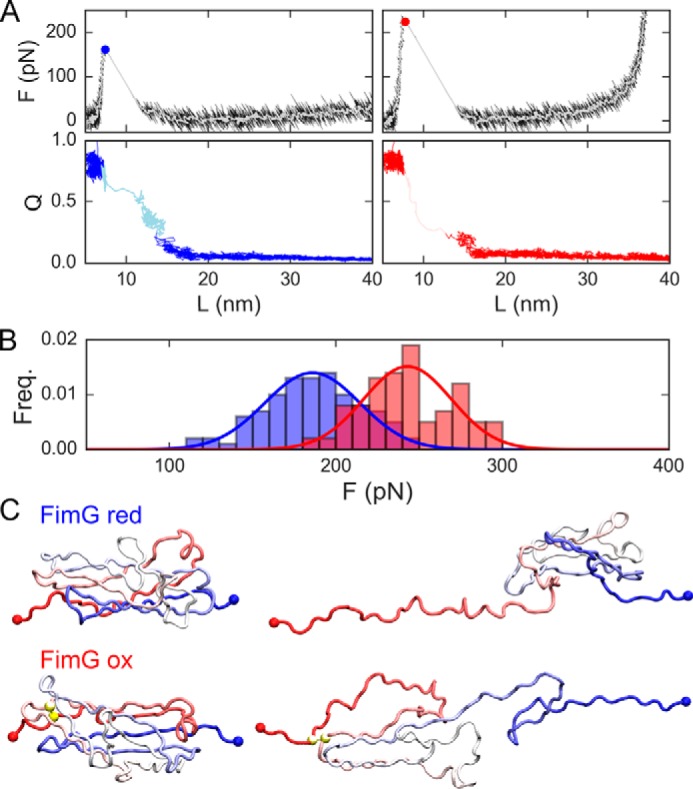
Figure 4.

Coarse-grained simulation results for oxidized and reduced FimG. A, force (top) and fraction of native contacts (Q, bottom) versus the protein extension (L) for representative trajectories of the model for the oxidized and reduced protein (blue and red, respectively). White lines are running averages of the forces. Filled circles represent the estimated unfolding force. In the QvsL plots, the lighter shade of color indicates the unfolding transition path. B, cumulative frequencies of the unfolding forces. C, representative snapshots from the simulations for the folded state (left) and the unfolded state reached right after the unfolding force peak (right) for reduced (top) and oxidized (bottom) FimG models. In the latter, yellow spheres indicate the position of disulfide bonded cysteines.
