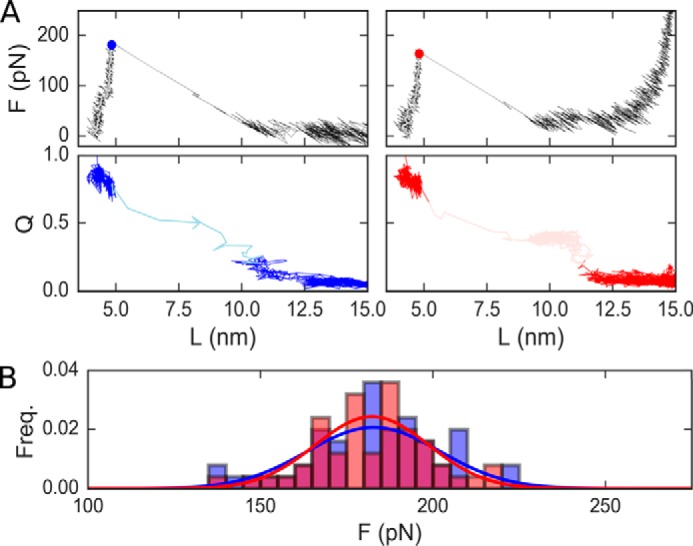
Figure 5.

Coarse-grained simulation results for oxidized and reduced titin I91G32C/A75C. A, force/Q versus extension plots for the reduced (blue) and oxidized (red) forms of the protein. Circles mark the unfolding force. Transition paths are shown in a lighter shade of each color. B, cumulative histograms of the simulated unfolding forces for the oxidized (red) and reduced forms (blue).
