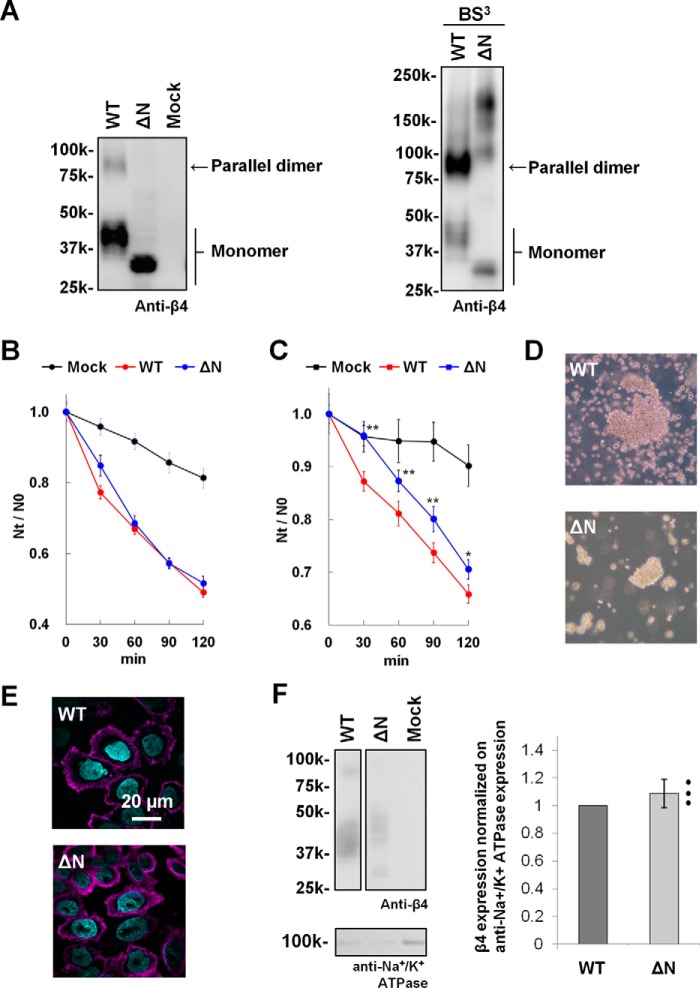
Figure 5.
Aggregation assay of ΔN-expressing cells. A, Western blot analysis of CHO cells stably expressing the WT and ΔN mutant of mouse β4. CHO cells were treated without (left panel) and with BS3 (right panel). Blots were probed with anti-β4. B, cell aggregation kinetics of CHO cells stably expressing the WT and ΔN mutant of β4 under non-reducing conditions. Aggregation is represented by the index Nt/N0, where Nt and N0 are the total number of particles at incubation times t and 0, respectively. Data are means ± S.E., n = 24, from three independent experiments. Mock (black), WT (red), and ΔN (blue). C, cell aggregation kinetics under reducing conditions. Data are means ± S.E., n = 45, from five independent experiments. *, p < 0.05; **, p < 0.01 (two-tailed unpaired Student's t test) compared with the WT. D, cell aggregation patterns of CHO cells stably expressing the WT and mutants of β4 under reducing conditions after a 120-min incubation. Shown are the WT (top panel) and ΔN (bottom panel). E, immunocytochemistry of CHO cells stably expressing the WT (top panel) and ΔN mutant (bottom panel) of β4. The β4 proteins were immunostained with anti-β4 and visualized with Alexa Fluor 647 (magenta), and nuclei were stained with Hoechst 33342 (cyan). F, cell surface biotinylation of CHO cells stably expressing the WT and ΔN mutant of β4. Shown are representative Western blots using anti-β4 (left panel, top) and anti-Na+/K+ ATPase (left panel, bottom) and quantification of the β4 bands normalized by the corresponding anti-Na+/K+ ATPase bands (right panel). Data are means ± S.D., n = 3, and individual data are shown in scatterplots.

