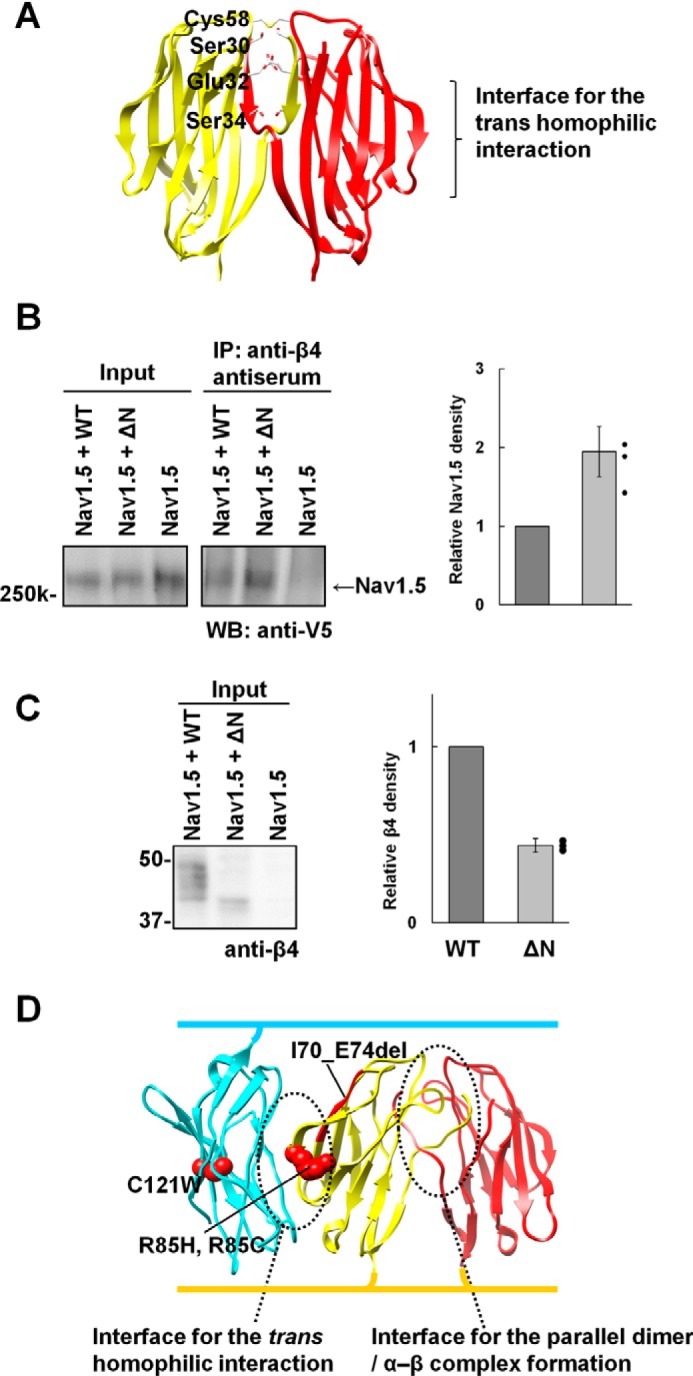
Figure 6.

Interface with the α subunit. A, the N-terminal residues required for modulation of the α subunits are mapped onto the β4 crystal structure. B, immunoprecipitation of HEK293 cells transiently transfected with Nav1.5-V5-His + WT (mouse), Nav1.5-V5-His + ΔN (mouse), and Nav1.5-V5-His alone using anti-β4 antiserum. Blots were probed with anti-V5. The graph shows the Nav1.5 intensity from Nav1.5 + ΔN–transfected cells relative to that from Nav1.5 + WT–transfected cells. Data are means ± S.D. from three independent experiments, and individual data are shown in scatterplots. C, Western blot analysis of the input samples for the co-immunoprecipitation study, probed with anti-β4. The graph shows the β4 intensity from Nav1.5 + ΔN–transfected cells relative to that from Nav1.5 + WT–transfected cells. Data are means ± S.D. from three independent experiments, and individual data are shown in scatterplots. D, mapping of the GEFS+ mutations on the β1 model structure. The model was generated by the superimposition of the monomer β1 model (built by the program MODELLER (34)) onto the mouse monoclinic β4 structure.
