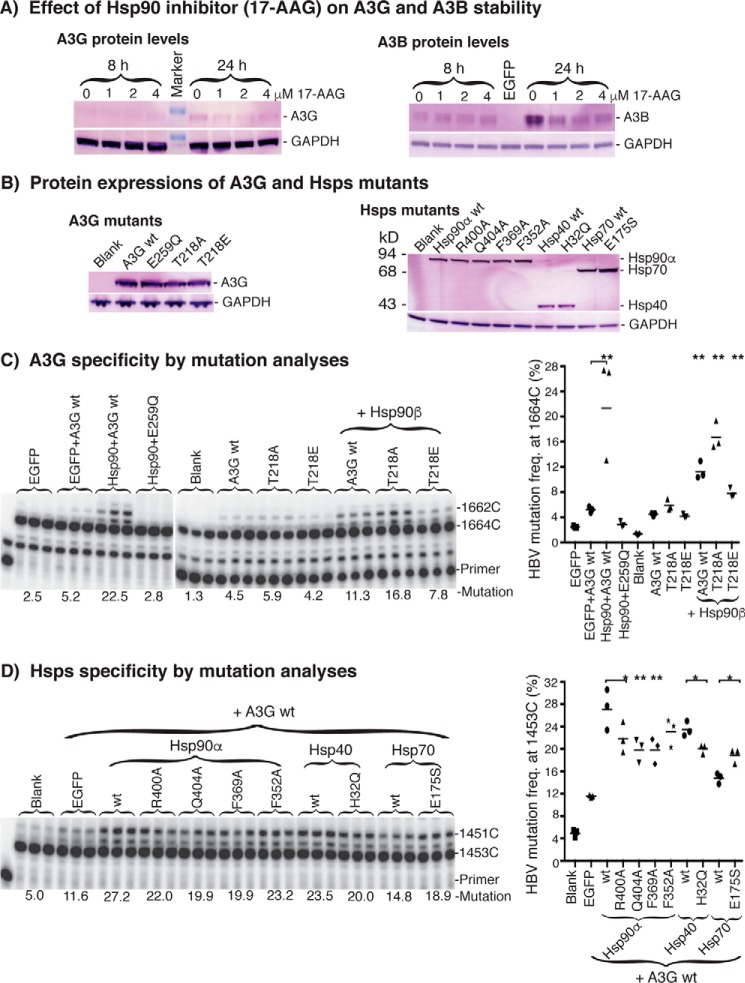
Figure 12.
Specificity of the interaction between Hsp90 and A3G. A, A3G and A3B protein stability analyses by Western blotting. A3G or A3B were co-transfected with Hsp90 into HepG2 cells, and the Hsp90 inhibitor 17-AAG was added to the indicated concentrations on the day after the transfection. The whole-cell proteins were extracted after an 8- or 24-h inhibitor treatment. A3G and A3B protein levels were determined by Western blotting using an antibody against the HA in A3G or FLAG tag in A3B, respectively. GAPDH was analyzed for the protein loading reference. B, A3G or Hsp mutant protein expression level analyses. Plasmids encoding A3G or Hsp mutants were co-transfected into HepG2 cells, and whole-cell proteins were extracted for Western blotting analyses with an antibody against the HA tag in A3G or the FLAG tag in Hsps. C, A3G specificity analyses by HBV DNA mutation. A3G mutants were co-transfected into HepG2 cells in the presence or absence of Hsp90. HBV DNAs were extracted from the cell lysates after 2 days of transfection, and viral DNA mutations were determined by pe1453 using an 88 °C 3D-PCR. D, Hsp specificity analyses by HBV DNA mutation. The Hsp mutants were transfected into HepG2 cells in the presence of A3G. The resultant HBV DNA mutations were determined by pe1453 using an 88 °C 3D-PCR. The data are presented graphically on the right. Each bar represents the average of triplicates for each treatment. Blank, background control without A3G co-transfection; asterisks, statistically significant differences comparing treatments with their corresponding wild-type control: **, 0.01 < p < 0.001; *, 0.05 < p < 0.01. The one-factor ANOVA statistical test was used.

