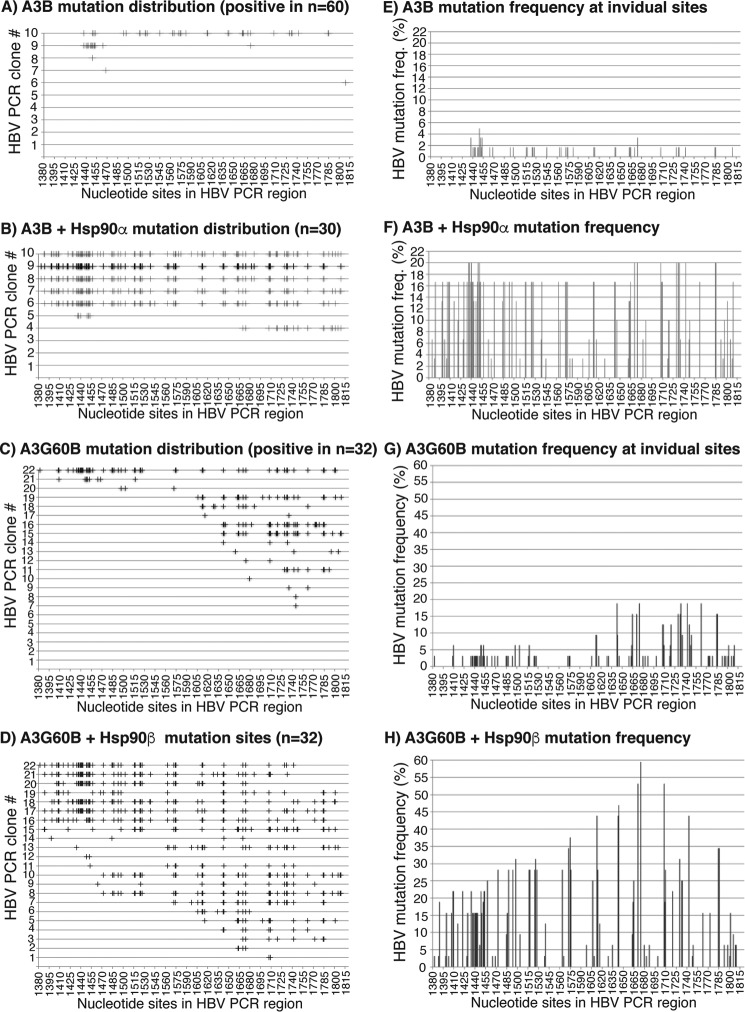
Figure 6.
Sequencing evaluation of the Hsp effects on A3B or A3G60B mutational activity. A3B or A3G60B was co-transfected with mock vector, Hsp90α, or Hsp90β into HepG2 cells as in Fig. 5. HBV DNA in the HBV capsids was extracted and amplified by 94 °C PCR and 88 °C 3D-PCR. A and B, distribution of C-to-T mutations in each mutation-positive clone after treatment with A3B or A3B + Hsp90α. 94 °C PCR amplicons were cloned into the TA cloning vector. Sixty clones for A3B and 30 for A3B + Hsp90α were randomly selected and sequenced. C-to-T mutations in each clone are represented by markers (+) on each line against their cytosine sites in the HBV PCR region. C and D, distribution of C-to-T mutations in each mutation-positive clone after treatment with A3G60B or A3G60B + Hsp90β. 88 °C 3D-PCR amplicons were cloned into the TA cloning vector, and 32 clones were randomly selected and sequenced. E–H, C-to-T mutation frequencies at individual cytosine sites in the HBV region were calculated based on their sequence data in A–D, respectively, and are presented as bars against their sites in the HBV region. The cytosine sites were numbered according to their positions in HBV by reference to V01460.1.

