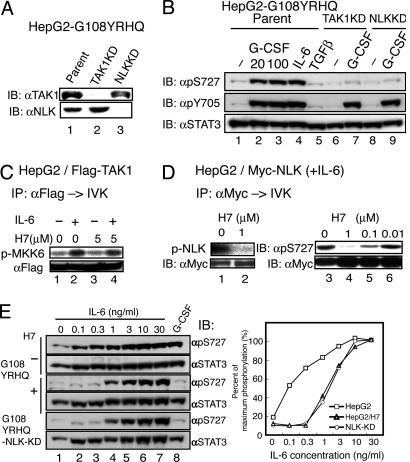
Fig. 3.
TAK1 and NLK are components of the YXXQ-mediated H7-sensitive kinase pathway leading to the phosphorylation of STAT3 Ser-727. (A) HepG2-G108YRHQ cells were infected with LV-U6-small interfering RNA against TAK1 and NLK to deplete TAK1 and NLK (TAK1KD and NLKKD, respectively). The silencing effect was evaluated by immunoblotting with the indicated Ab. (B) HepG2-G108YRHQ cells and the TAK1KD or NLK KD HepG2-G108YRHQ cells were left unstimulated or stimulated with the indicated cytokines at 20 ng/ml (lanes 2, 4, and 5) or at 100 ng/ml (lanes 3, 7, and 9) for 15 min. The WCEs were immunoblotted with the indicated Abs. (C) The Flag-TAK1 immunoprecipitates from unstimulated or IL-6-stimulated HepG2 cells were subjected to the in vitro kinase assay as in Fig. 1B in the absence or presence of 5 μM H7. (D) HepG2-Myc-NLK cells were stimulated with IL-6 at 20 ng/ml for 15 min. The immunoprecipitates of WCEs with anti-Myc Ab were subjected to the in vitro NLK kinase assay as in Fig. 2C (lanes 1 and 2) or the in vitro NLK kinase assay by using GST-STAT3 (534–770) made in E. coli (lanes 3–6) in the presence of the indicated amounts of H7. Phospho-Ser-727 was detected with an antiphospho-Ser-727 Ab (Right Upper). The amount of NLK used for each kinase assay is shown in Lower. (E) HepG2-G108YRHQ cells pretreated with nothing (–) or H7 at 50 μM (+) and HepG2-G108YRHQ-NLK-KD cells were left unstimulated or stimulated with the indicated concentrations of IL-6 (lanes 2–7) or 20 ng/ml G-CSF for 15 min. The WCEs were immunoblotted with the indicated Abs (Left). The intensities of each band were quantified by a densitometer (GS-700, Bio-Rad), and the percentage of STAT3 in the phosphorylated form was calculated (Right). The value in HepG2 cells stimulated with 30 ng/ml IL-6 was defined as 100%, because almost all of the STAT3 was phosphorylated on Ser-727, as judged by its migration pattern on SDS/PAGE (data not shown). Average values of two independent experiments are shown.

