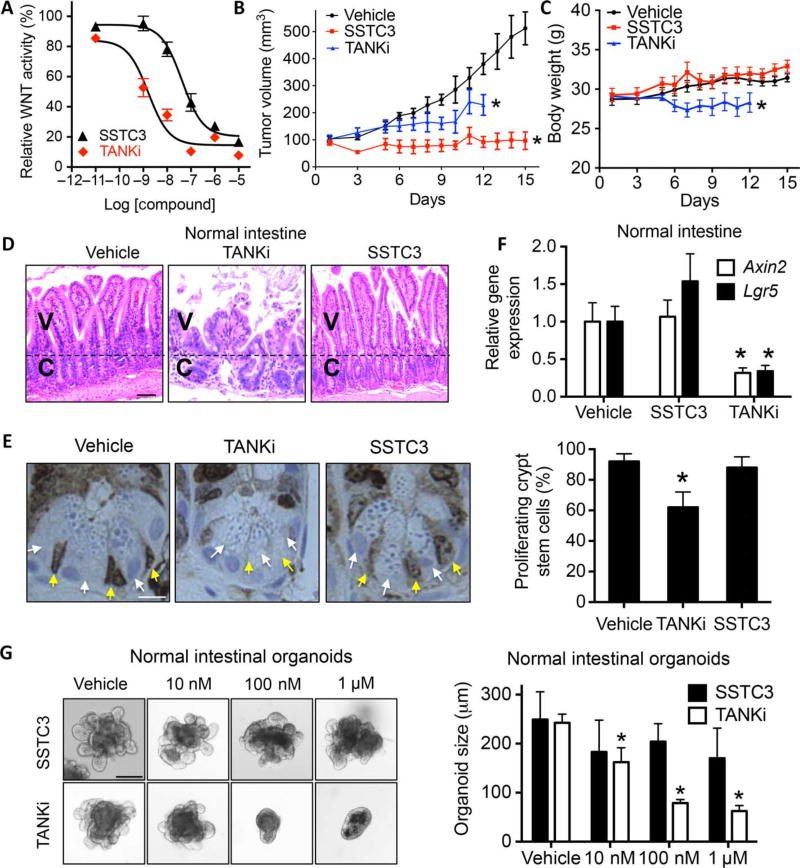
Fig. 5. SSTC3 exhibits efficacy with minimal GI toxicity.
(A) TOPflash WNT reporter assay in 293T cells cultured with the indicated doses of SSTC3 and G007-LK (TANKi) in the presence of WNT3A. Representative data are shown (means ± SD, n = 3). (B) SW403 xenograft growth in mice treated with SSTC3 (15 mg/kg ip) or TANKi (40 mg/kg ip) for the indicated days (n = 7 in each group). (C to E) Body weight in mice (C) and representative H&E (D) and KI67 staining of mouse intestines (E) after treatment as described in (B). V, villi; C, crypt. Yellow and white arrows indicate crypt base columnar and paneth cells, respectively. Quantitative analysis of 120 crypts from four separate mice is shown (right) (E). Scale bars, 50 µm (D) and 10 µm (E). (F) qRT-PCR analysis on intestines from nude mice treated with vehicle, TANKi (40 mg/kg), or SSTC3 (15 mg/kg) (n = 4 in each group). (G) Size of wt organoids after 5-day treatment with vehicle or the indicated doses of SSTC3 or TANKi. Left: Representative images. Right: Quantification of mean size from five independent cultures. Scale bar, 100 µm. Data are means ± SEM (Student’s t test, *P ≤ 0.05).

