
Figure 3.
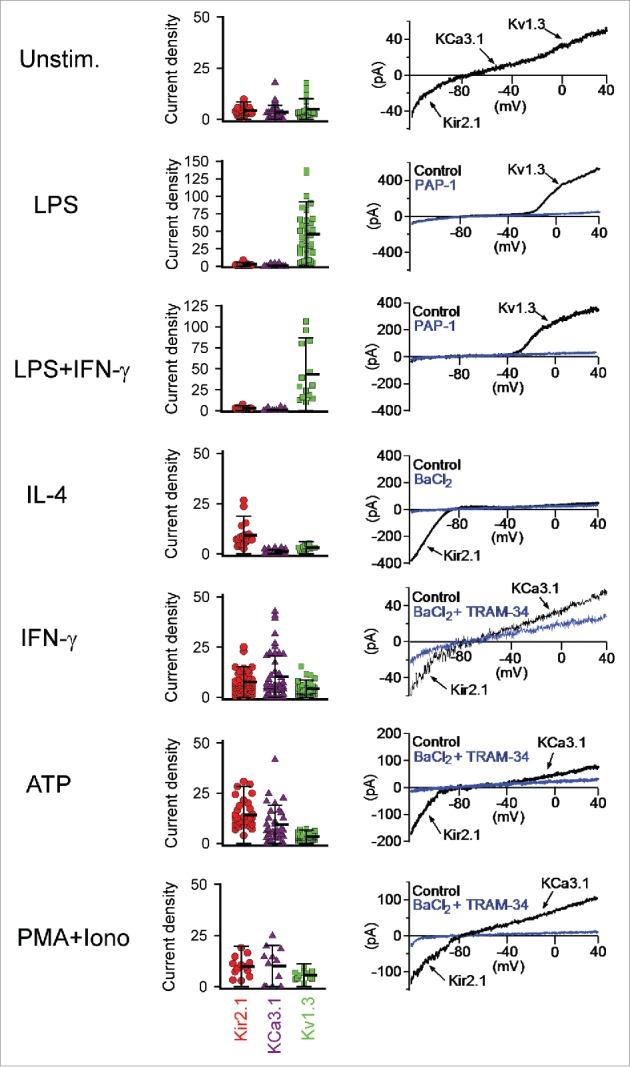
Scatterplots of the functional KV1.3, KCa3.1 and Kir2.1 expression levels measured by whole-cell patch-clamp in unstimulated neonatal mouse microglia and in microglia 40–48 h after stimulation with LPS, LPS plus IFN-γ, IL-4, IFN-γ, ATP or PMA plus ionomycin. Redrawn from Nguyen et al.27