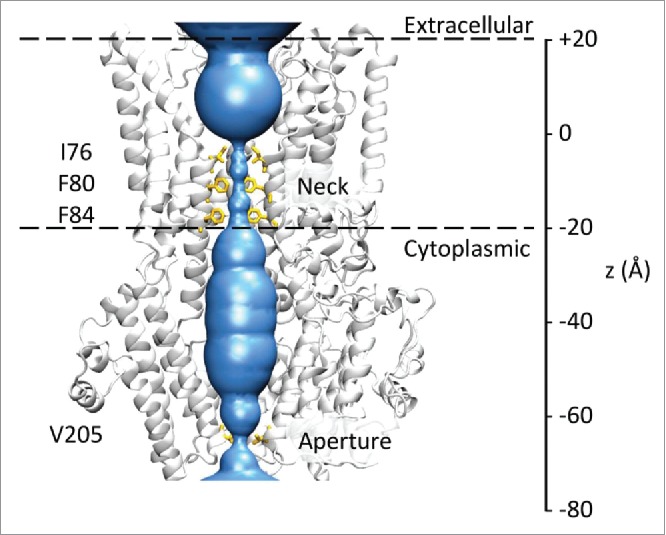
Figure 1.

Structure of the BEST1 channel. The protein fold of 3 of the 5 subunits of the channel is shown in gray, with the pore lining surface (calculated using HOLE) in blue. Hydrophobic side-chains lining the neck and aperture regions of the pore are shown as sticks in yellow. The 2 broken horizontal lines indicate the approximate location of the membrane. The bilayer normal and pore axis correspond to the z-axis shown on the right.
