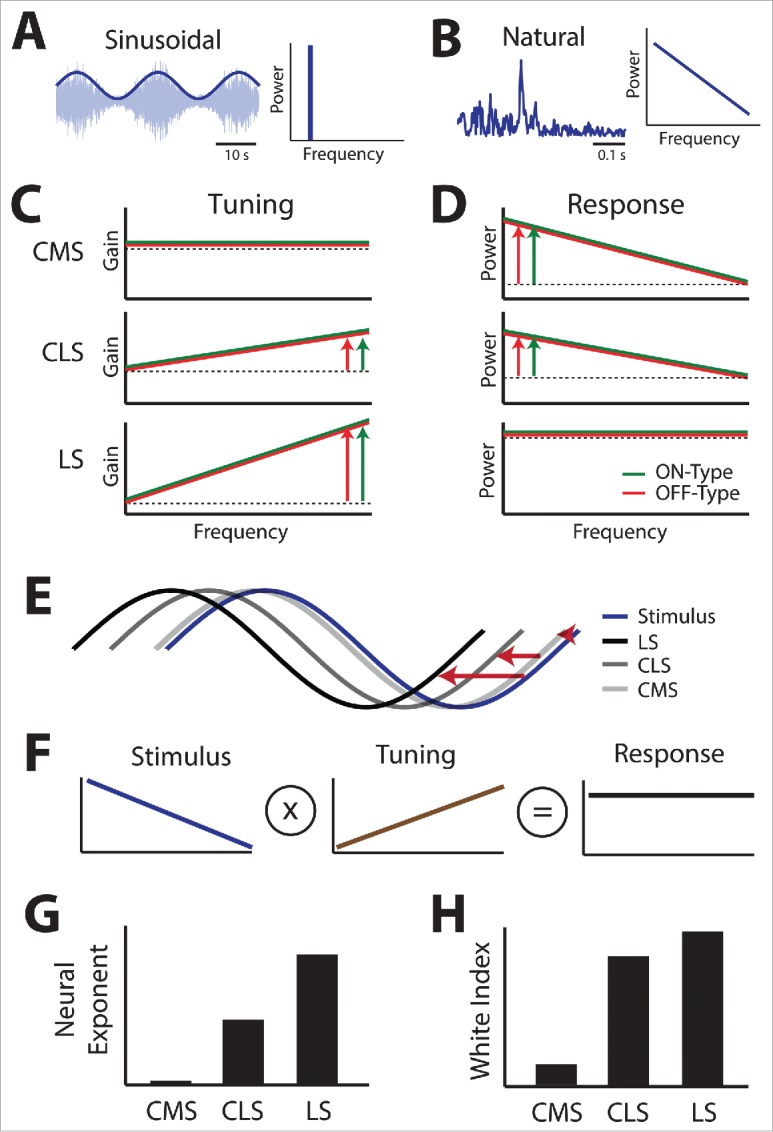
Figure 6.

Summary of the differential tuning to sinusoidal 2nd order stimuli seen across maps and their consequences on coding of natural 2nd order stimuli in relationship to SK1 channel expression. (A) Left: example noisy waveform (light blue) whose amplitude (dark blue) is modulated sinusoidally. Right: all spectral power is found at the sinusoidal frequency. (B) Left: example amplitude waveform obtained under natural conditions. Right: spectral power of the natural stimulus decays as a power law as a function of frequency. (C) Tuning curves to 2nd order for CMS (top), CLS (middle), and CMS (bottom) obtained using sinusoidal stimulation for ON-type (green) and OFF-type (red) cells. In each case, a constant tuning (dashed black) is shown for comparison. The vertical arrows indicate how strongly gain increases as a function of increasing frequency. (D) Neural response power spectra for CMS (top), CLS (middle), and LS (bottom) under natural 2nd order stimulation for ON-type (green) and OFF-type (red) cells. In each case, a horizontal line (dashed black) is shown for comparison. The vertical arrows indicate how strongly response power decays as a function of increasing frequency. Note the similarity in responses for both ON- and OFF-type cells. E) Stimulus (blue) and neural responses of CMS (light gray), CLS (darker gray), and LS (black) neurons. The horizontal red arrows quantify the phase advance between the neural responses and stimulus. F) Schematic showing that, to optimize coding, the tuning curve (middle) must oppose stimulus statistics (left) to give rise to a neural response that is independent of frequency (right). G) Summary of the different neural tuning exponents seen across the different maps. H) Summary of the different white index quantifying response constancy as a function of frequency across the different maps.
