Figure 2.
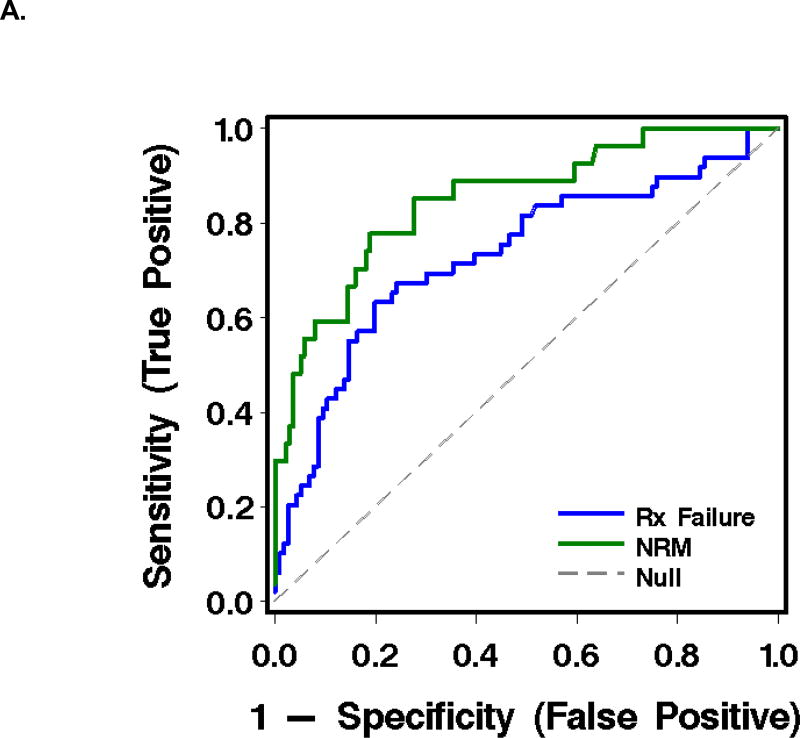
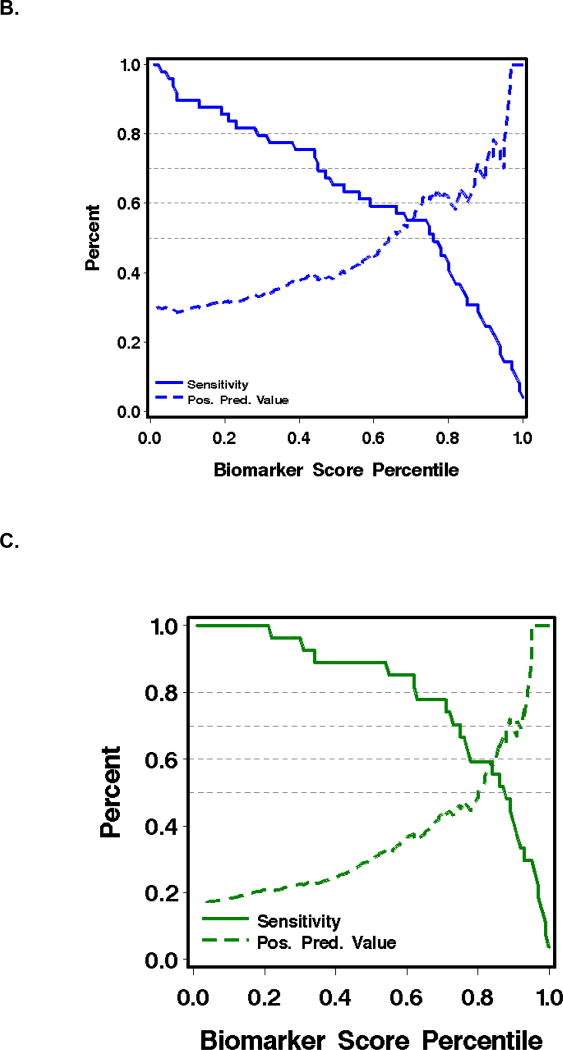
Receiver-operating characteristic (ROC) curves and graphics of sensitivity and positive predictive value for biomarkers in plasma at treatment day 14 for the prediction of outcomes in patients with acute GVHD (see Table 3).
A. ROC curves, where the blue line represents operating characteristics of (TIM3 + ST2) for prediction of GVHD treatment failure, and the green line, (TIM3 + sTNFR1) for prediction of NRM.
B. Sensitivity (solid lines) and positive predictive value (dashed lines) of (TIM3 + ST2) for predicting failure of initial GVHD treatment.
C. Sensitivity (solid lines) and positive predictive value (dashed lines) of (TIM3 + sTNFR1) for predicting NRM within one year after day 14 of treatment.


