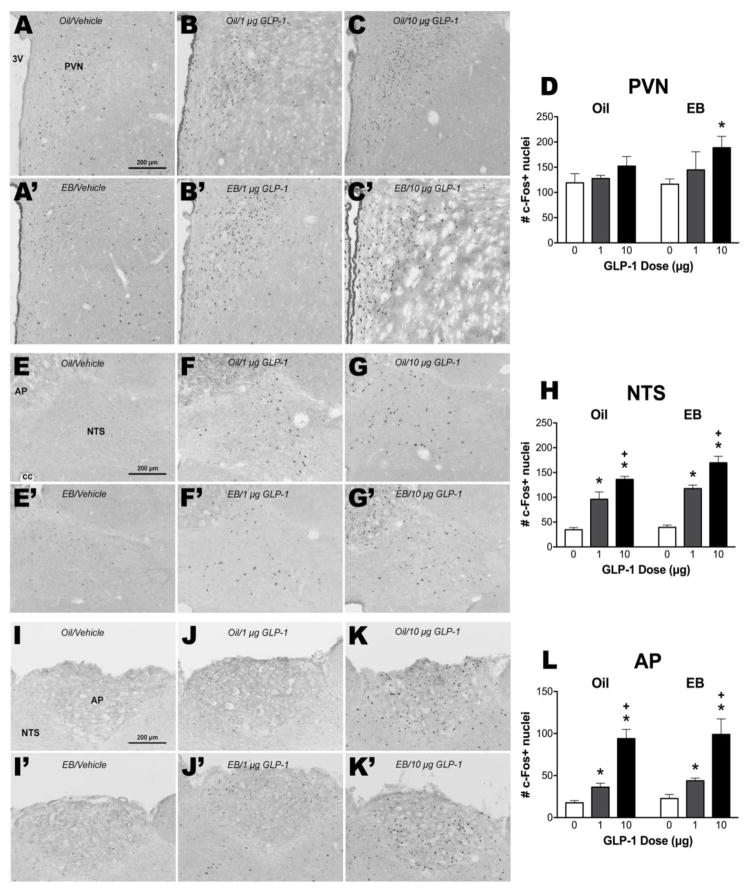
Figure 3. Effect of GLP-1 on c-Fos induction in oil- or EB-treated female rats.
Representative images of c-Fos induction responses to intra-LV injection of vehicle, 1 μg GLP-1, or 10 μg GLP-1 in the PVN (A–C, A′–C′), the NTS (E–G, E′–G′), and the AP (I–K, I′–K′) from oil-treated and EB-treated rats. Panels D, H, and L show mean ± SEM c-Fos-positive cell nuclei per section through each brain region. *p<0.05 relative to respective hormone group vehicle condition, +p<0.05 relative to respective hormone group 1 μg GLP-1 condition.

