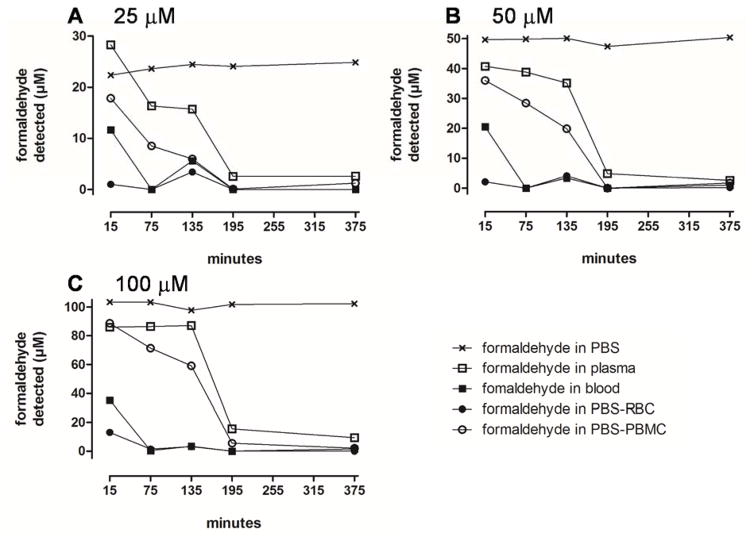
Figure 2.
Time course of free formaldehyde concentrations in different matrices incubated with formaldehyde at an initial concentration of 25 (A), 50 (B) and 100 μM (C). Matrices are indicated by the following symbols: × - PBS; □ - plasma; ■ - whole blood; ● - red blood cells; ○ - peripheral blood mononuclear cells.

