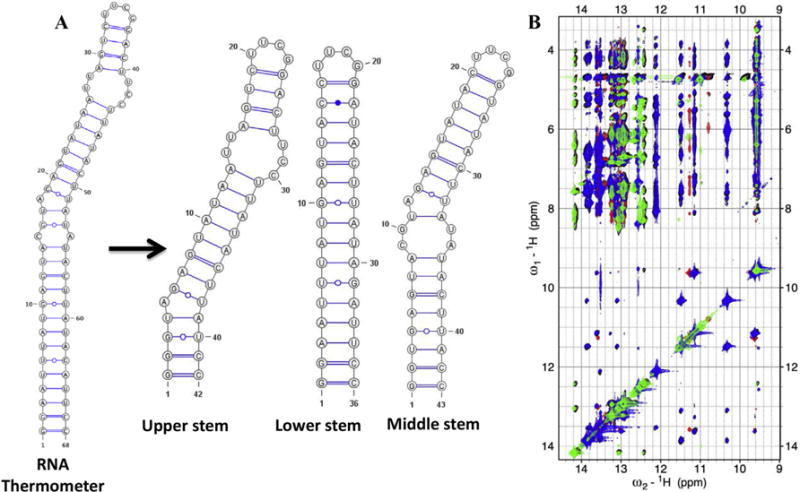
Fig. 3. NMR Assignment strategy for an RNA thermometer of ~70 nucleotides.

(A) Three smaller constructs were prepared; the first corresponds to the upper stem, the second overlaps with the lower stem while the third is representative of the middle region of the RNA. (B) An overlay of the imino regions of 2D 1H–1H NOESY spectra. The black color represents the spectrum for the complete RNA, while green, blue and red are from the fragments, upper, lower and middle stem, respectively. The spectra of the fragments match the full RNA almost perfectly. (For interpretation of the references to colour in this figure legend, the reader is referred to the web version of this article.)
