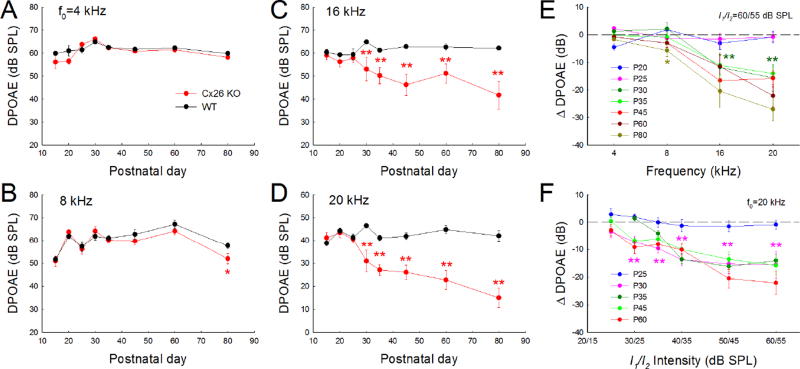
Fig. 4.
Progressive reduction of acoustic emission in Cx26-Prox1 cKO mice. DPOAE (2f1–f2) at different postnatal days (P15–80) recorded from Cx26 cKO mice (6-24 ears) and WT mice (6-30 ears). A–D: Progressive reduction of DPOAE in Cx26-Prox1 cKO mice in different frequencies. The reduction first occurs in the high-frequency region and then extends to the low-frequency region. Before P25, there is no any reduction in DPOAE in the recording frequency regions. However, at P30 afterward, significant reduction in DPOAE can be seen in 8-20 kHz (panel B-D). E: Decrease of DPOAE in Cx26 cKO mice (referring to those in WT mice) at different frequencies and postnatal days. Different color asterisks represent the earliest detection of significant reduction in DPOAE at different frequencies. F: Decrease of DPOAE in Cx26 cKO mice at different stimulus sound intensities (I/O plot) and different postnatal days. The reduction of DPOAE in Cx26 cKO mice appears large in high-intensities. One and two asterisks represent P < 0.05 and 0.01 (one-way ANOVA with a Bonferroni correction), respectively.

