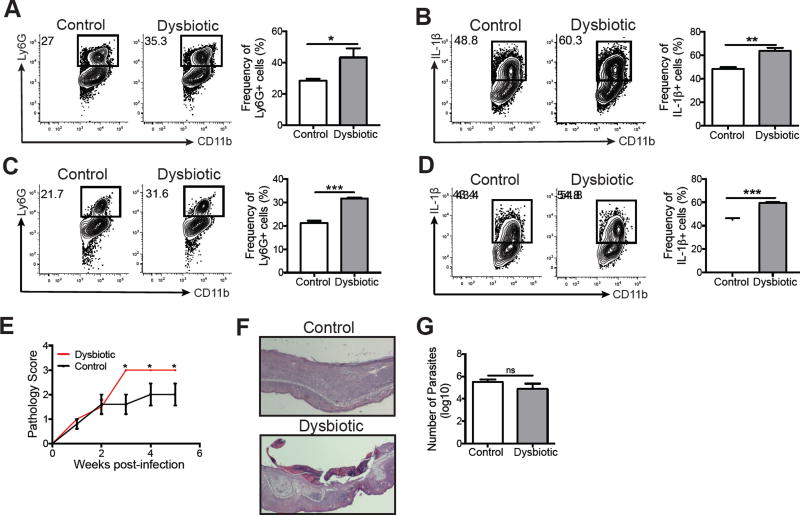
Figure 7. Dysbiosis exacerbates inflammation during DNFB treatment and L. major infection.
Naïve C57BL/6 mice acquired dysbiotic microbiota after co-housing with L. major infected mice for 6 weeks. Control and dysbiotic mice were then sensitized and challenged with DNFB. Representative flow cytometry plots and graphs of skin cells depict the expression of (A) CD11b+ Ly6G+ cells and (B) CD11b+ IL-1β+ cells. Control and dysbiotic mice were intradermally infected with L. major parasites and the cells from the lesions were collected at 5 weeks post-infection. Representative flow cytometry plots and graphs of skin cells depict the expression of (C) CD11b+ Ly6G+ cells and (D) CD11b+ IL-1β+ cells. (E) A pathology score was used to assess disease severity over 5 weeks post-infection. (F) Representative ear skin sections stained with hemotoxylin and eosin of L. major infected control and dysbiotic mice. (G) Parasite burdens were assessed using a limiting dilution assay after 5 weeks post-infection. Data are representative of two independent experiments (For dysbiotic group, n = 1 ear tissue each from 4 mice; for control group, n = 1 ear tissue each from 5 mice). ns = not significant; *, p < 0.05; **, p < 0.01; ***, p < 0.001; ****.

