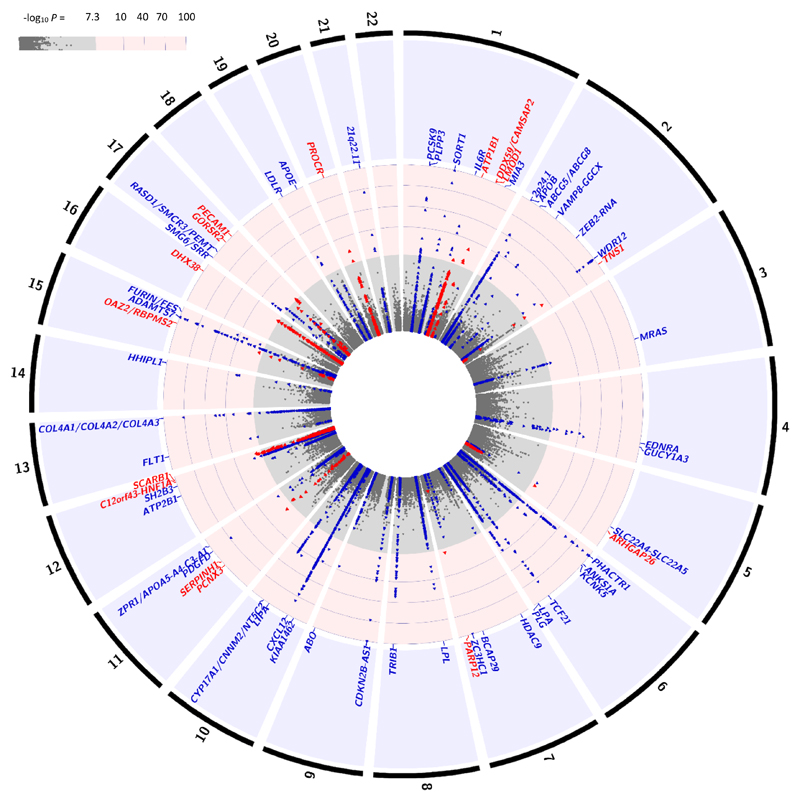
Figure 2.
Plot showing the association of ~79,000 variants with CAD (-log10P-value) in up to 88,192 cases and 162,544 controls from the all ancestry fixed effects meta-analysis. SNPs are ordered in physical position. No adjustments to P-values to account for multiple testing have been made. The outer track represents the chromosomal number. Blue dots represent known loci and red dots are the new loci identified in the current study. Each association peak is labeled with the name of the closest gene(s) to the sentinel SNP. GWAS significance (-log10(P) ~ 7.3).

