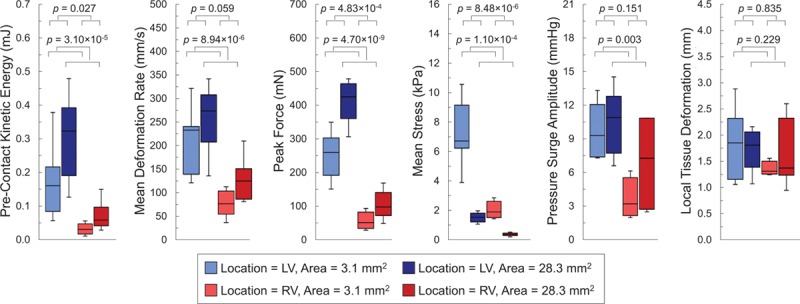
Figure 4.

Mechanically induced premature ventricular excitation (PVEM) thresholds. Box-and-whisker plots of mechanical stimulation characteristics (precontact kinetic energy, mean deformation rate, peak force, mean stress, intraventricular pressure surge amplitude, and local tissue deformation) at PVEM threshold with varying combinations of freewall contact location (midleft ventricular [mid-LV; blues boxes] and midright ventricular freewall [mid-RV; red boxes]) and contact area (3.1 mm2 [lighter boxes] and 28.3 mm2 [darker boxes]). Only local tissue indentation (far right) forms a uniform predictor of PVEM threshold across the various stimulation protocols. Measurements from 7 hearts. P values are for comparison of contact location and area by 2-way ANOVA with Tukey–Kramer post hoc tests.
