Figure 5.

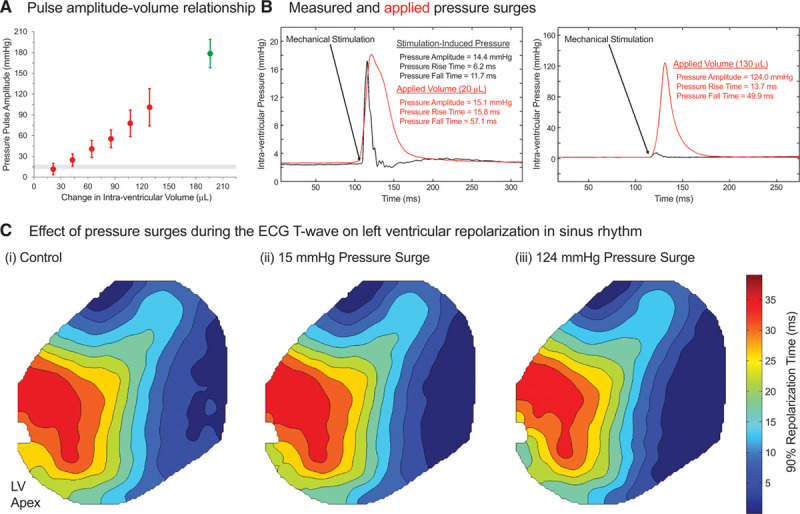
Intraventricular volume pulses. A, Relationship between intraventricular balloon volume pulse and peak pressure, averaged from 6 hearts. Red points indicate volumes assessed in the standard experiments (which were not associated with elevated creatine kinase release; Figure III in the Data Supplement), whereas a mechanically induced premature ventricular excitation (PVEM)–inducing excessive volume pulse (200 μL) is shown in green. The gray horizontal band indicates the range of pressure amplitudes measured during PVEM-inducing epicardial mechanical stimulation. B, Representative pressure surges measured during epicardial mechanical stimulation (black) and with active injection/retraction of 20 μL (left) or 130 μL (right) intraventricular volume pulses (red). C, Representative optical mapping data for 90% repolarization time (0 ms represents earliest repolarization in the associated map) in sinus rhythm during (i) control and application of (ii) 15 mm Hg or (iii) 124 mm Hg pressure surges (using stimuli shown in B) applied at the peak of the T wave. Isochrones represent 5 ms steps. Note that the notch at the left ventricular (LV) apex is caused by the surface ECG electrode in the field of view.
