Figure 2.

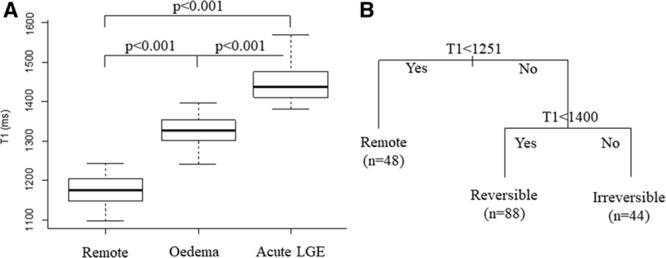
Distribution of T1 values and identification of T1 thresholds. A, Mean T1 values in the remote, oedematous, and late gadolinium enhancement (LGE) myocardium on the derivation cohort; (B) classification tree model was applied to identify T1 acute threshold values T1rev and T1irrev.
