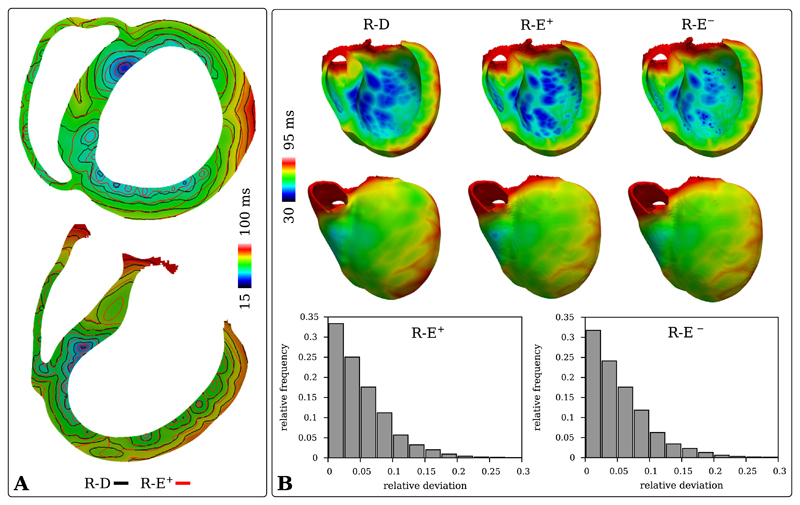
Fig. 3.
Comparison of activation patterns in the human BiV benchmark with HPS computed with R-D and R-E models at mesh resolutions of 220 μm and 880 μm, respectively. A) Isochronal maps computed from the activation maps obtained with the high resolution R-D model and the lower resolution R-E+ model. B) Upper panels show activation maps ta,R-D, ta,R-E+ and ta,R-E− at the posterior endocardium and anterior epicardium as well as over the transmural cross sections. Lower panels show relative deviation histograms of ta,R-E+ and ta,R-E− w.r.t. ta,R-D.

