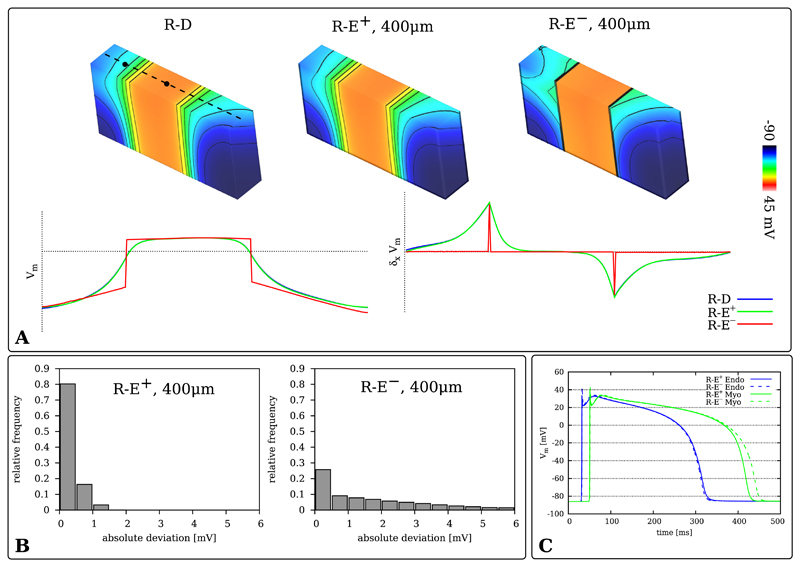
Fig. 5.
A) Differences in transmembrane voltage distribution Vm(xmid, tr50) along a transmural line (dashed line) at tr50 = 305 ms, the instant of 50% repolarization, at the center of the cross section between R-D (100 μm) and the R-E models (400 μm). Vm and its normalized spatial derivative across the center line of the cross section are displayed as graphs. B) Histograms of the absolute deviation of Vm from the R-D model for the R-E+ and R-E− models at 400 μm spatial resolution. C) Time traces of action potentials taken along a central transmural line at positions located at the center of endocardial and myocardial layer (the black circles on the dashed center lines in panel A) for R-E+ and R-E− models. R-D traces are not shown as they are not discernible from the R-E+ case.

