
Figure 2.
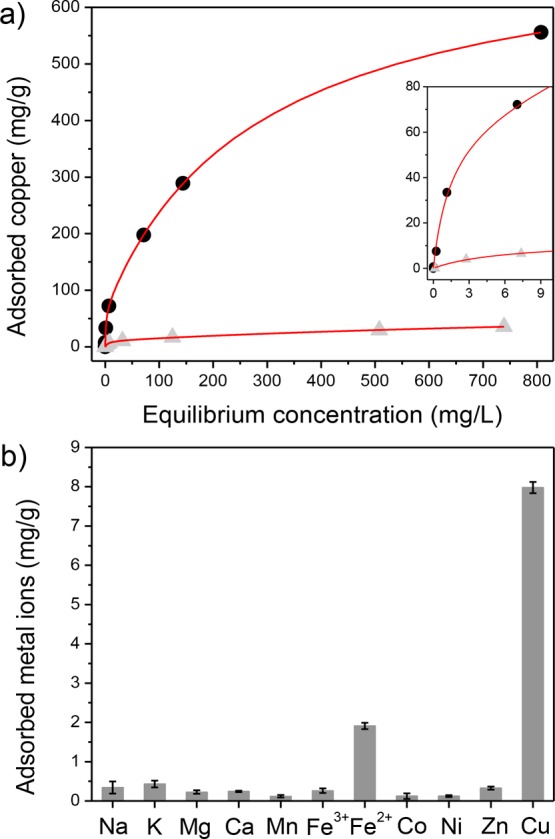
(a) Copper adsorption isotherm for PAF-1-SMe (black circles) and PAF-1-CH2Cl (gray triangles) fit using a dual-site Langmuir model (red line). The inset plot is a magnified portion of the initial equilibrium concentration range (0–10 mg/L) and the adsorbed amount of copper (mg/g). (b) PAF-1-SMe capture capacities of physiologically relevant metal ions (10 ppm). Data collected in 100 mM HEPES buffer, pH 6.7.