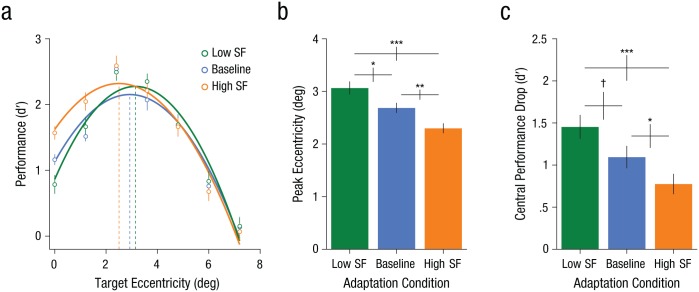
Fig. 4.
Effects of spatial-frequency (SF) adaptation in the neutral attention condition. Mean performance (a) is shown at each of the seven target eccentricities as a function of adaptation condition. For each condition, the curves correspond to the best-fitting second-order polynomials (all R2s > .9), and the dashed vertical lines highlight the eccentricity at which the peak performance occurred. Estimates for mean peak eccentricity (b) and mean central performance drop (c) are shown as a function of adaptation condition. Symbols indicate significant (*p < .05, **p < .01, ***p < .001) and marginal (†p < .10) differences between conditions. Error bars for means represent ±1 SEM within subjects (Morey, 2008), and error bars for the differences between condition means represent ±1 SEM.

