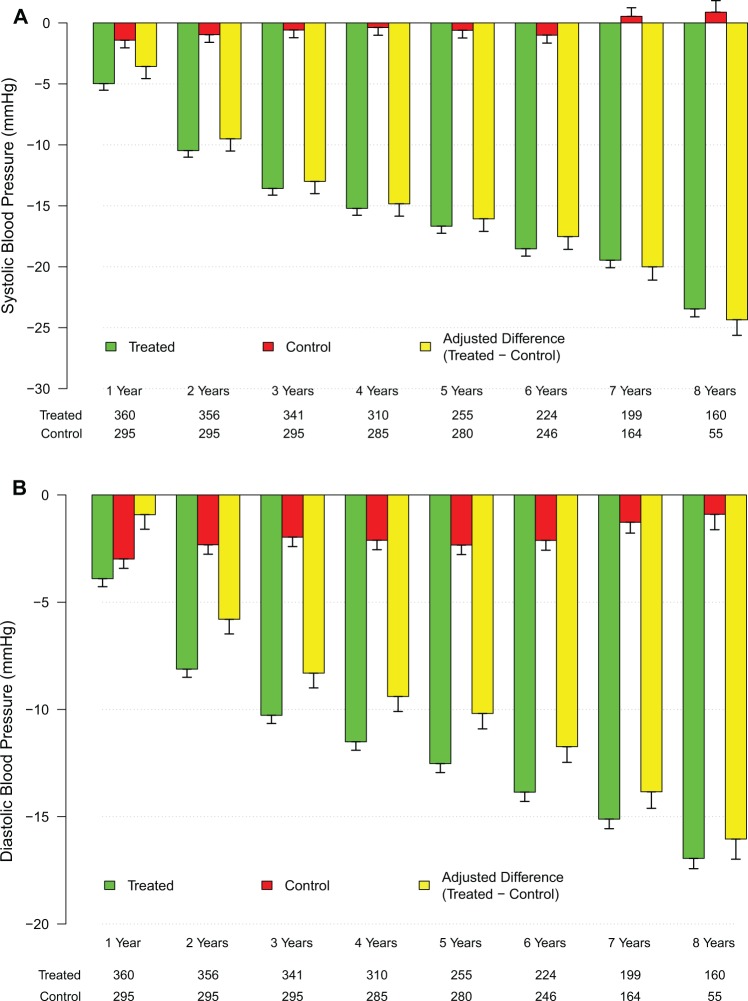
Figure 2.
Changes in systolic and diastolic blood pressure in the testosterone (T)-treated and untreated (control) groups. A, Changes in systolic blood pressure (yellow bars) were adjusted for baseline differences between the T-treated (green bars) and untreated (red bars) control groups. B, Changes in diastolic blood pressure (yellow bars) were adjusted for baseline differences between the T-treated (green bars) and untreated (red bars) control groups.

