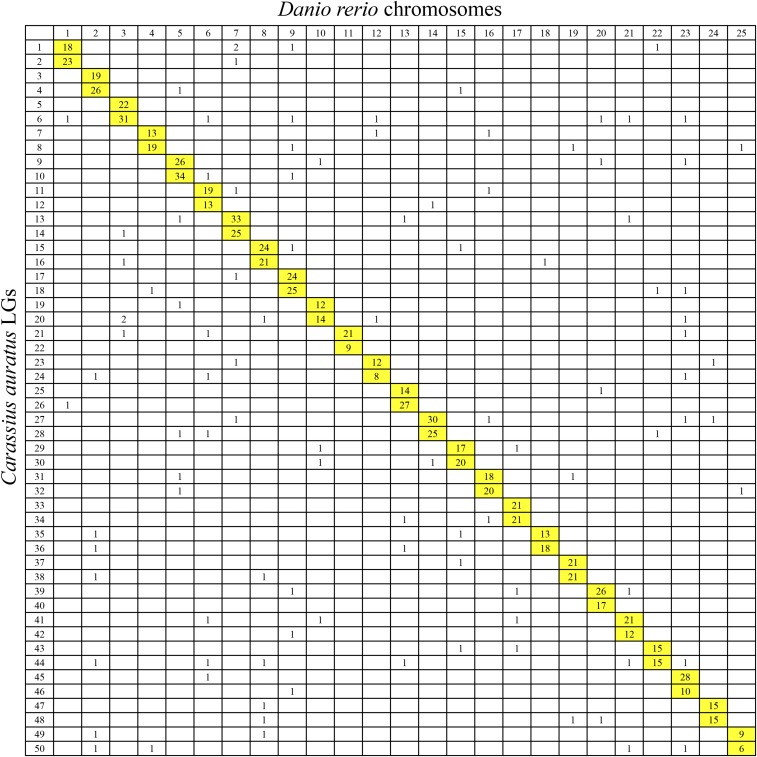
Figure 3.
Genomic synteny visualized using Oxford grids between crucian carp linkage groups and zebrafish chromosomes. The numbers in each cell represent number of homologous loci between crucian carp consensus linkage groups and zebrafish chromosomes. Homologous linkage groups and chromosomes are highlighted in yellow.

