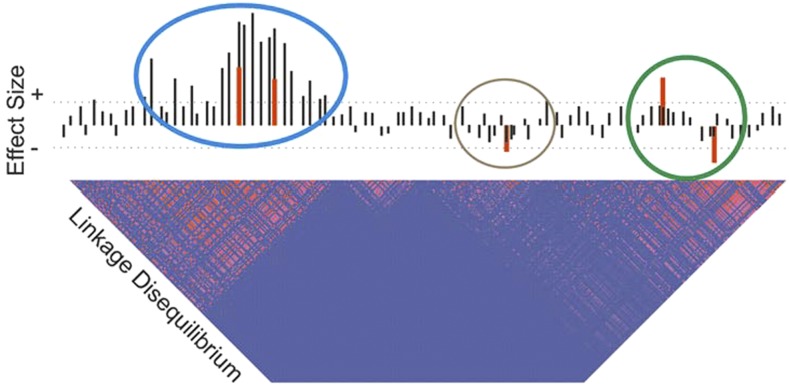
Figure 1.
Schematic of multisite regulation of gene expression. Black bars indicate univariate estimates of allelic effects of minor alleles increasing (above the horizontal) or decreasing (below the horizontal) gene expression without conditioning on other sites. Red bars show the actual effects at five single nucleotide polymorphisms in this locus, which has a linkage disequilibrium profile with two large and one small block of elevated linkage disequilibrium (pink squares). Dotted horizontal lines indicate a statistical significance threshold, which is only exceeded in the univariate modeling by the two left-hand sites (blue circle). Since these two sites act in the same direction, they reinforce one another, leading to overestimation of their effect sizes, whereas the two at the right (green circle) interfere with one another antagonistically, leading to underestimation of their effects. The effect at the fifth site (brown circle) may only be identified following conditional analysis.

