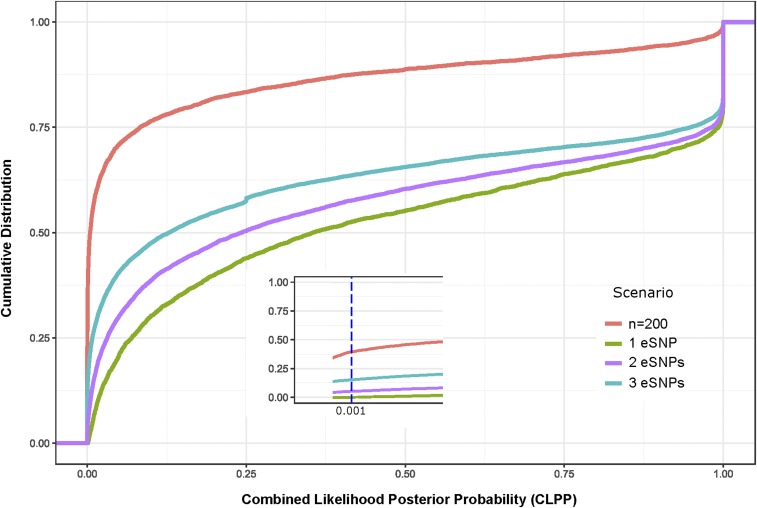
Figure 6.
Colocalization with eCAVIAR in the presence of multiple regulatory sites. Cumulative Distribution Functions summarize CLPP scores for 4000 simulations each with one, two, or three assigned causal sites within a contiguous block of 100 SNPs. Green, purple, and teal curves show progressive degradation of evidence as the number of modeled causal variants increases, for simulations with 1835 subjects. The red curve shows that more than half of the simulations with just 200 subjects for the eQTL component have CLPP < 0.01, and just one-quarter >0.1, compared with one quarter >0.98 with 1835 subjects. CLPP, Combined Likelihood Posterior Probabilities; eQTL, expression quantitative trait locus; SNP, single nucleotide polymorphism.

