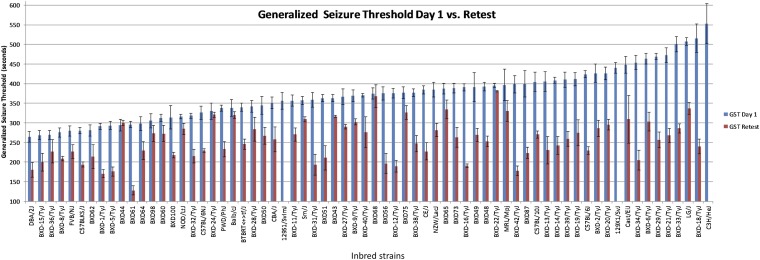
Figure 2.
HMDP responses to initial and retest seizures spanning the repeated-flurothyl seizure model. Latency to loss of postural control (GST) for 68 HMDP strains surveyed for our association analyses. Blue bars indicate the initial GST (day 1) average for each strain with error bars showing the SEM. Red bars indicate retest GST averages for the strain with error bars showing the SEM. GST values are given in seconds.

