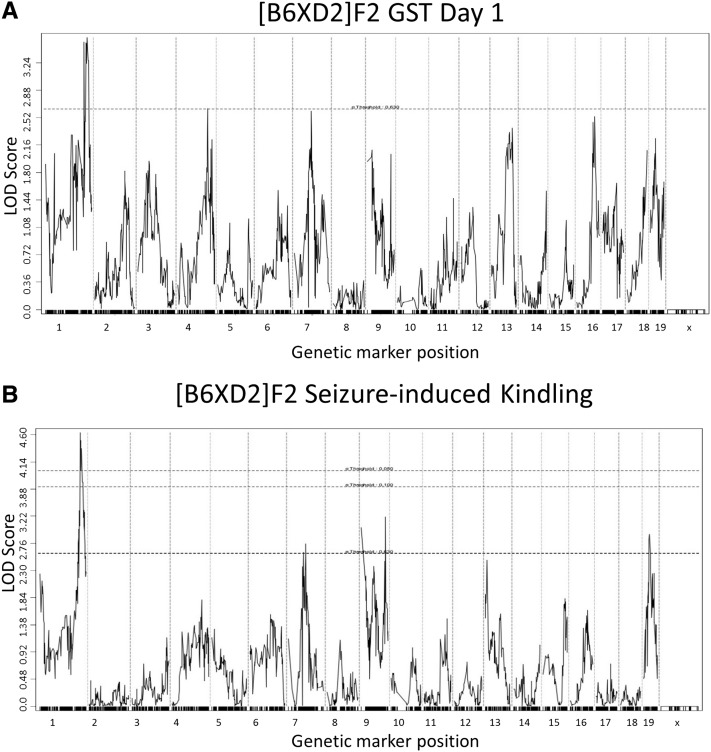
Figure 4.
Regression analysis of [B6×D2] F2 intercross. (A) GST1 susceptibility was used as a quantitative trait to confirm the presence of a distal suggestive QTL corresponding to Szs1. (B) The slope of induction phase GSTs was used as a quantitative measure of kindling that also identified the Szs1 locus.

