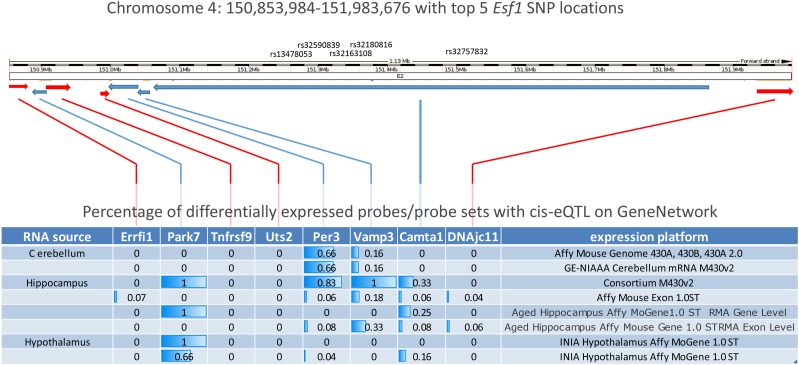
Figure 7.
Summary figure of Esf1 candidate loci cis-eQTL. Schematic of the genomic interval surrounding Esf1 including the approximate location of top SNPs from GWAS analysis (top) and the relative size and orientation of genes in the vicinity (red arrows indicate plus strand, blue arrows indicate minus strand) adapted from the Ensembl website (GRCm38). Table showing percentage of probes sets showing cis-eQTL/candidate gene from various datasets available on the GeneNetwork systems genetics resource. Note predominance of cis-eQTL on genes on the minus strand.

