Figure 2.
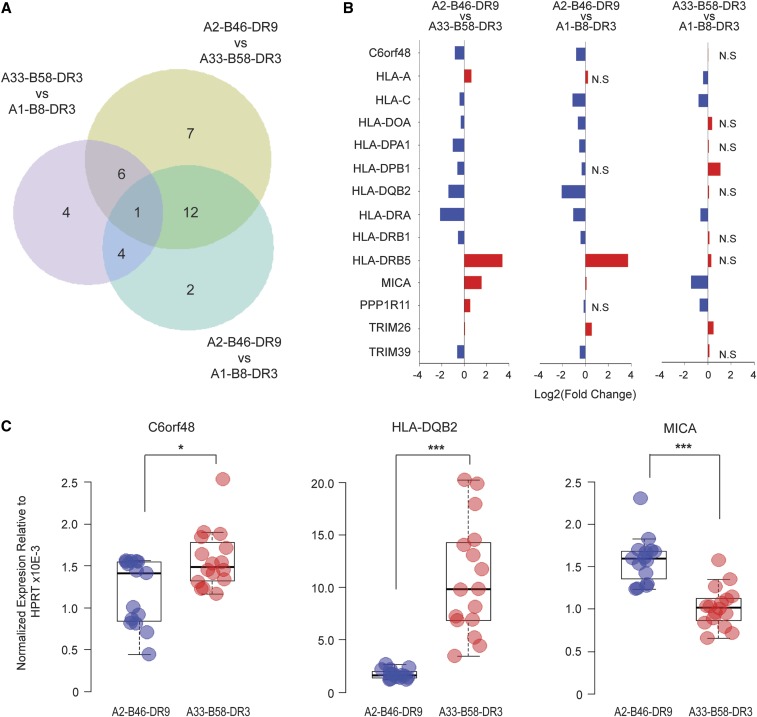
Differential gene expression analysis between haplotypes. (A) Venn diagram indicating the number of significant differentially expressed genes (adjusted P-value < 0.05) between pairwise haplotype comparisons. (B) Top 15 differentially expressed genes with adjusted P-value < 0.001 in at least one of the pairwise haplotype comparisons. (C) Relative expression of C6orf48, HLA-DQB2, and MICA between the A2-B46-DR9 (n = 15) and A33-B58-DR3 haplotypes (n = 16) in B-LCLs (Mann–Whitney U test). * P-value < 0.05, *** P-value < 0.0001. HPRT, hypoxanthine phosphoribosyltransferase.

