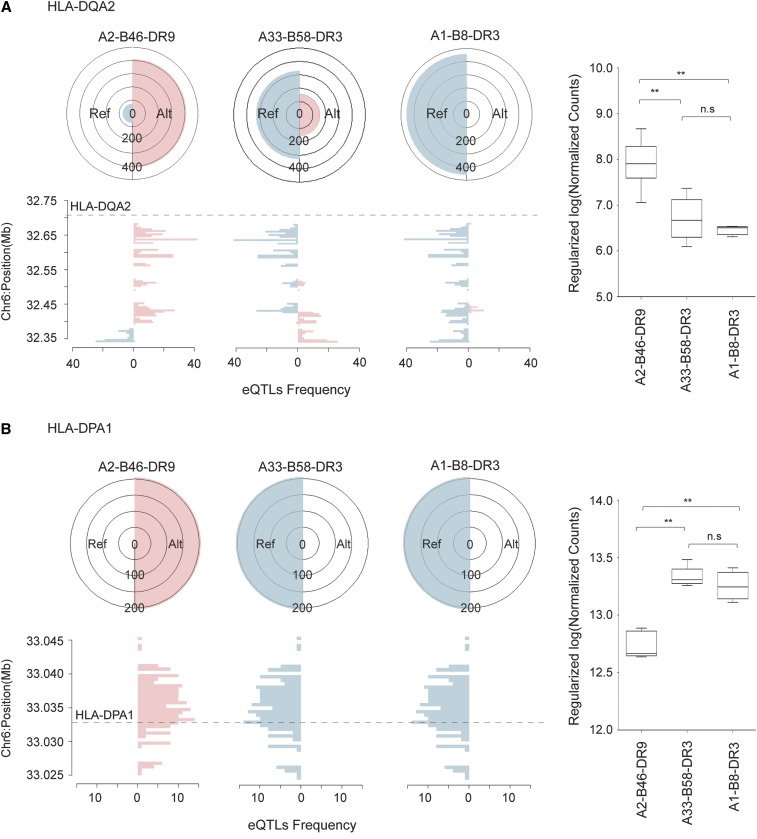
Figure 3.
Allelic proportions of the haplotype sequence variations mapping to eQTL SNPs and the expression level of the target gene for (A) HLA-DQA2 and (B) HLA-DPA1. In each panel, the top left side shows the number of eQTL SNPs with reference allele (blue) and alternate allele (pink) for each haplotype while the bottom left side shows the frequency of eQTL at each 5 kb window relative to the location of their target gene. The right side of each panel presents the gene expression level for each haplotype derived from eight MHC-homozygous B-LCLs. ** Adjusted P-value < 0.05. B-LCL, B-lymphoblastoid cell line; eQTL, expression quantitative trait loci; MHC, major histocompatibility complex; n.s, not significant; SNP, single nucleotide polymorphism.

