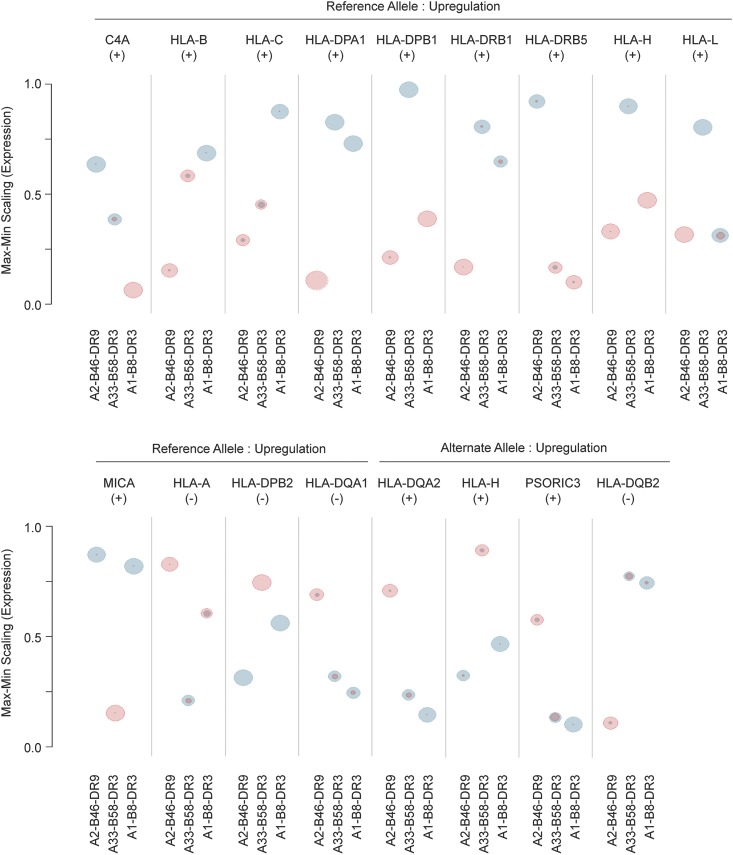
Figure 4.
Correlation of allelic proportion of eQTL to expression levels of genes that are differentially expressed between haplotypes. The expression of genes was rescaled relatively among the haplotypes. The size of the spheres represents the relative number of eQTL with reference allele (blue) or alternate allele (pink) for each haplotype. The (+)/(−) notations below each gene name indicates the direction of the correlation for each corresponding gene. The exact count of the allelic proportion of the eQTL for each gene is shown in Figure S2 in File S1. eQTL, expression quantitative trait loci; Max, maximum; Min, minimum.

