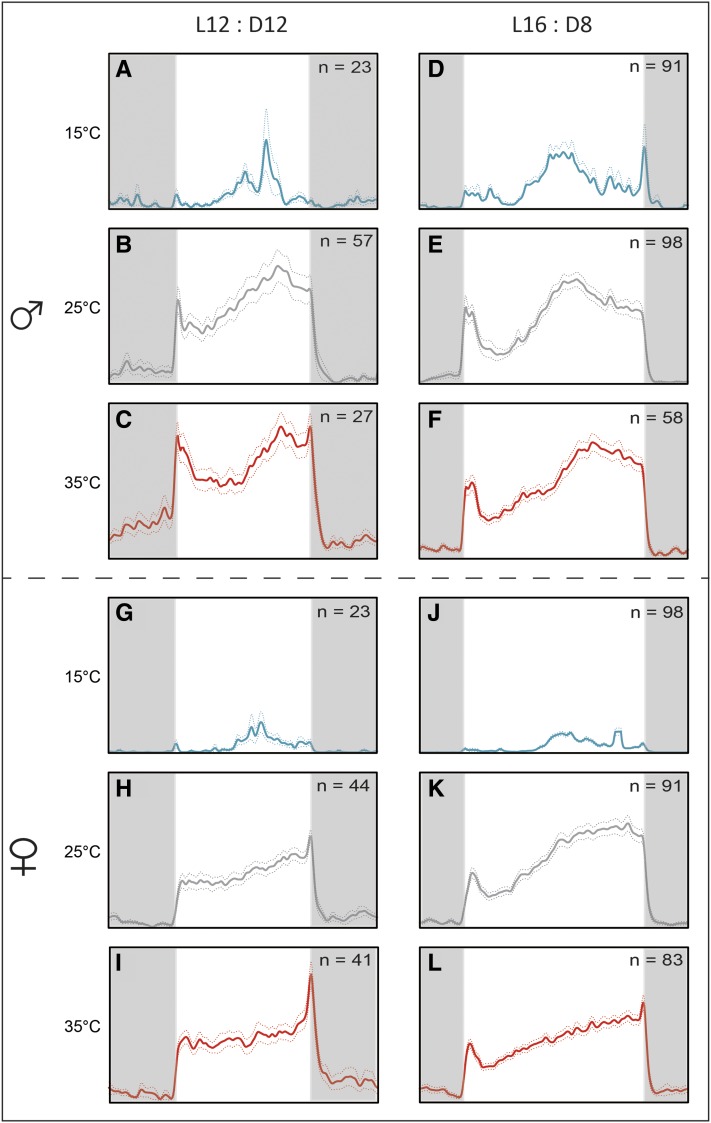
Figure 2.
Locomotor activity pattern of M. domestica kept in LD 12:12 (left column) and LD 16:8 (right column). Blue, gray, and red lines represent 15° (low, panels A, D, G, J), 25° (normal, panels B, E, H, K), and 35° (high, panels C, F, I, L) temperatures, respectively. Flies were measured individually. The average ± SD is shown as dashed colored lines; n, numbers of animals used in the experiment. Vertical dashed gray line corresponds to ZT 12 under the LD 16:8 regime.

