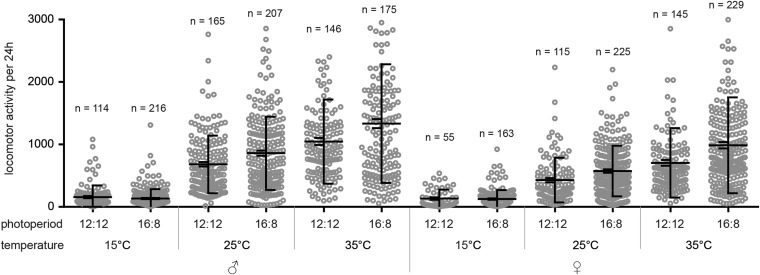
Figure 3.
Locomotor activity levels of M. domestica plotted as the number of laser beam crosses per 24 hr. The left side depicts the mean ± SEM; the right side depicts the average ± SD. Each circle corresponds to individual flies, and number of analyzed days is shown above each category. See Table S3 for statistics.

