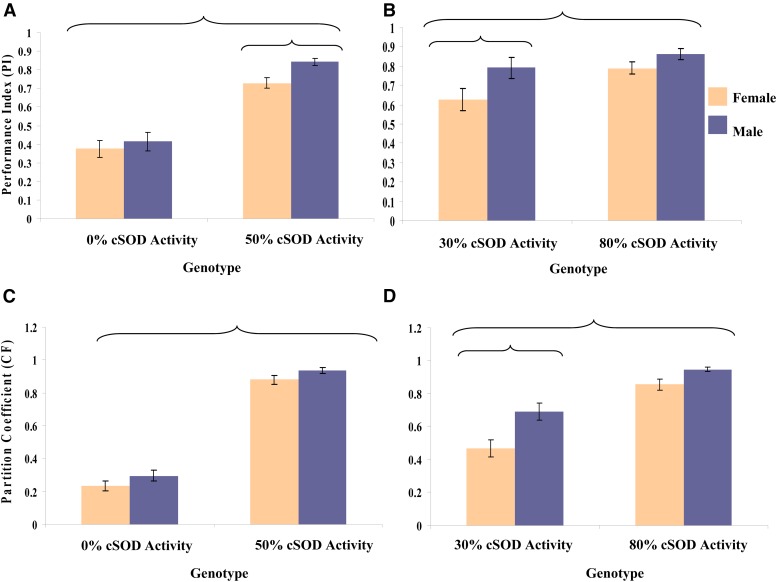
Figure 7 .
(A and B) Mean ± SEM of the negative geotaxis performance index (PI), and (C and D) mean ± SEM of the climbing partition coefficient (CF), for adult male and female flies pooled across the eight DGRPi genetic backgrounds within each genotype. ANOVA was used to test the factor effects with an α of 0.05. Partial eta squared (ηp2) was calculated to quantify the effect of each factor. (A) cSOD Activity, F1,156 = 169.6, P < 0.0001, ηp2 = 0.52; sex, F1,156 = 4.83, P = 0.0294, ηp2 = 0.030. (B) cSOD Activity, F1,100 = 7.33, P = 0.008, ηp2 = 0.0683; sex - F1,100 = 8.80, P = 0.0038, ηp2 = 0.0809. (C) cSOD activity, F1,269 = 501.0, P < 0.0001, ηp2 = 0.651. (D) cSOD activity, F1,175 = 61.6, P < 0.0001, ηp2 = 0.260; sex - F1,175 = 20.8, P < 0.0001, ηp2 = 0.106. Brackets enclose significantly different groups. cSOD, cytosolic copper/zinc superoxide dismutase.

