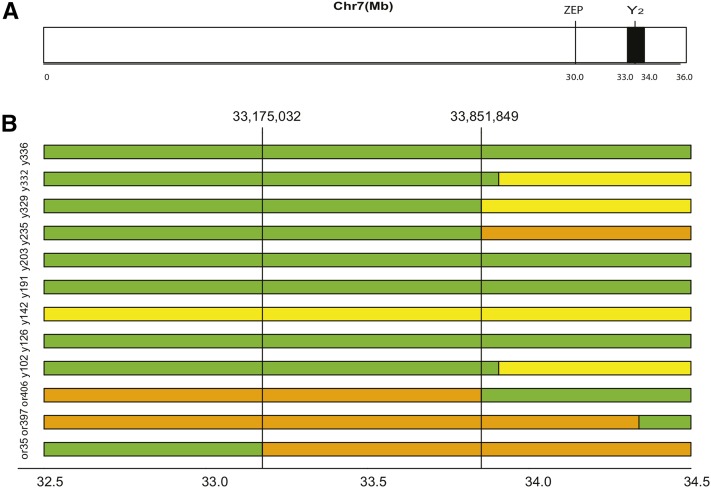
Figure 3.
Fine-mapping the Y2 locus on chromosome 7. (A) Chromosome 7 including the location of Y2, delimited by SNP markers S7_33,019,341 and S7_33,979,543 in black, and the nearest carotenoid biosynthetic gene, ZEP at 30,085,761. (B) Fine-mapping of the Y2 region, delimited by SNP markers S7_33,175,032 and S7_33,851,849. Orange homozygous recessive, yellow heterozygous, and yellow homozygous dominant genotypes are represented by orange, green, and yellow bars, respectively. Genotypes used for fine mapping are shown to the left of the colored bars. Horizontal axis values indicate physical location (megabase).

