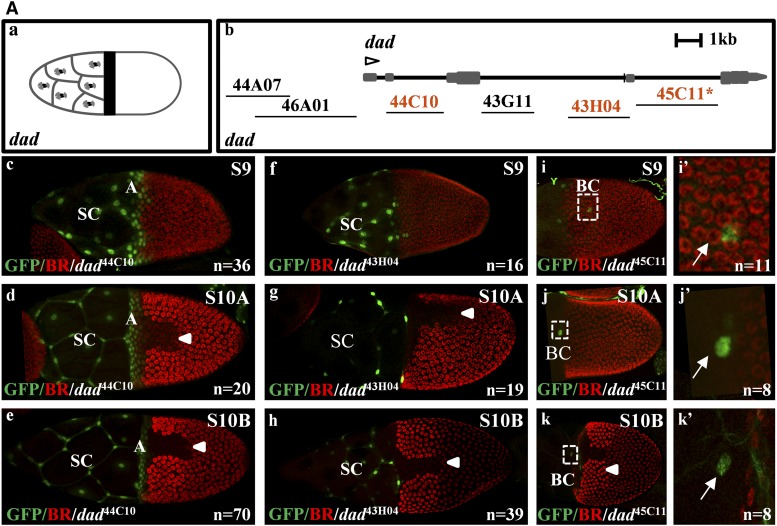
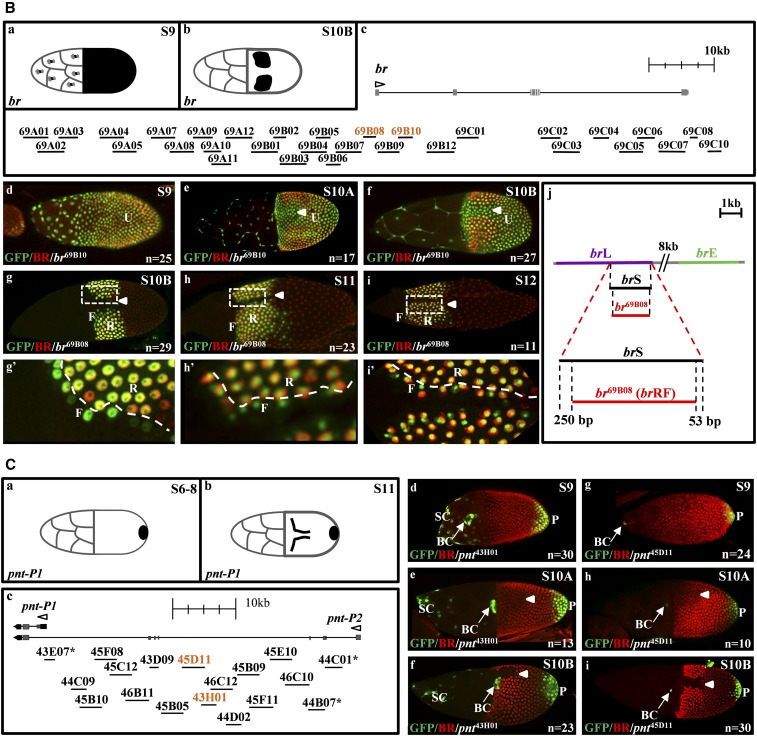
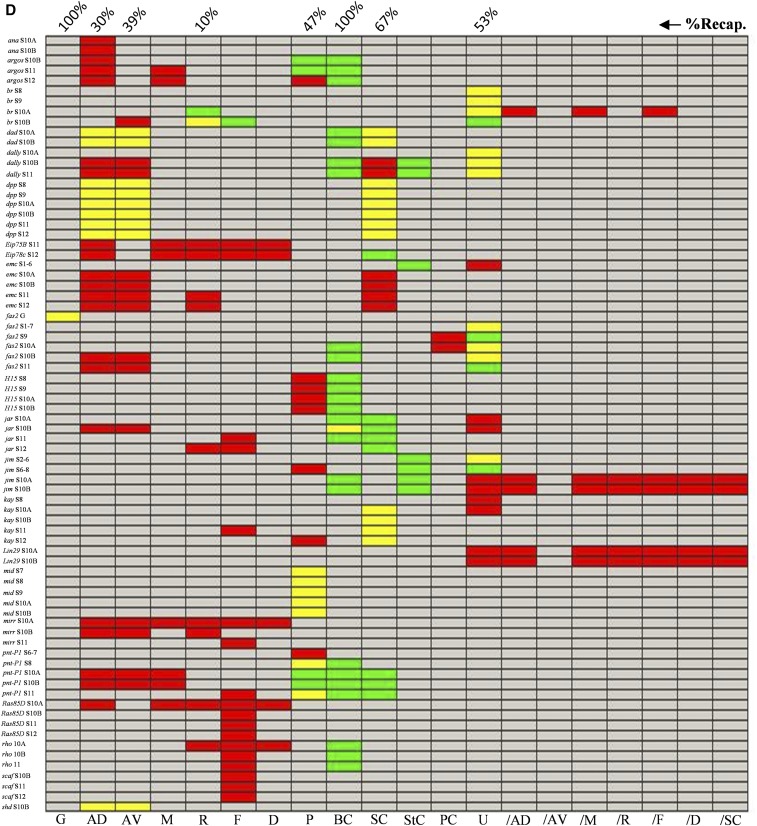
Figure 2.
Expression domains of several FlyLight lines. (Aa) A cartoon describing the daughters against dpp (dad) expression pattern in the stretched cells (SC) and anterior (A) domains. (Ab) The gene model for dad and the associated FlyLight fragments screened during oogenesis. The GFP-positive lines are marked in orange. * indicates a line with expression not seen in endogenous gene patterns. Open arrowhead denotes the TSS and the direction of the gene in the locus. (Ac–e) GFP expression driven by dad44C10 during stages 9–10B in the stretched cells (SC) and centripetally migrating follicle cells, denoted as the anterior (A) domain. BR is used as a spatial marker. n is the number of images represented by this image. Arrowheads denote the dorsal midline. (Af–h) GFP expression driven by dad43H04 during stages 9–10B in the SC. (Ai–k) GFP expression driven by dad45C11 during stages 9–10B in the border cells (BC). (Ai′–k′) Insets of (i–k) (white arrow denotes the BC). Additional stages can be found in Figure S2D. (Ba and b) A cartoon describing the expression patterns of early and late br. (Bc) The gene model for br and the associated FlyLight fragments screened during oogenesis. The GFP-positive lines are marked in orange. (Bd–f) GFP expression driven by br69B10 during stages 9–10B is uniform in all follicle cells. (Bg–i) GFP expression driven by br69B08 during stages 10B–12 in the roof (R) and floor (F) domains (brRF). (Bg′–i′) Insets of (Bg–i). (Bj) The position of the different br fragments: brE, brL, and brS (Charbonnier et al. 2015), and br69B08 (brRF, this screen). br69B08 is 250 and 53 bp shorter on the left and right ends, respectively, than the brS fragment. Additional stages can be found in Figure S2C. (Ca and b) A cartoon describing the expression patterns of pointed-P1 (pnt-P1) during stages 6–8 in the posterior (P) domain, and at the floor (F) and P domains at stage 11. (Cc) The gene model for pnt isoforms and the associated FlyLight fragments screened during oogenesis. The GFP-positive lines are marked in orange. (Cd–f) GFP expression driven by pnt43H01 during stages 9–10B in the SC, border cells (BC), and P domains. (Cg–i) GFP expression driven by pnt45D11 during stages 9–10B in the BC and P domains. Additional stages can be found in Figure S2R. (D) A binary matrix representing all gene expression patterns (red) and FlyLight GFP-positive lines (green). The overlap between the two data sets is denoted in yellow. The matrix is based on assigning mutually exclusive domains to patterns (Figure 1 and Figure S2, i and ii). Domains include germarium (G), splitting the anterior domain to anterior dorsal (AD) and anterior ventral (AV), midline (M), roof (R), floor (F), dorsal (D), posterior (P), stretched cells (SC), stalk cells (StC), polar cells (PC), and uniform (U). Additional domains are included as not one of the previously listed (/) for domain exclusions. The complete description of these domains can be found in Figure S2, i and ii. On the y-axis is the gene name at a specified developmental stage. Percent recapitulation (%Recap.) represents the percent of GFP patterns that overlap with the endogenous pattern in each domain.


