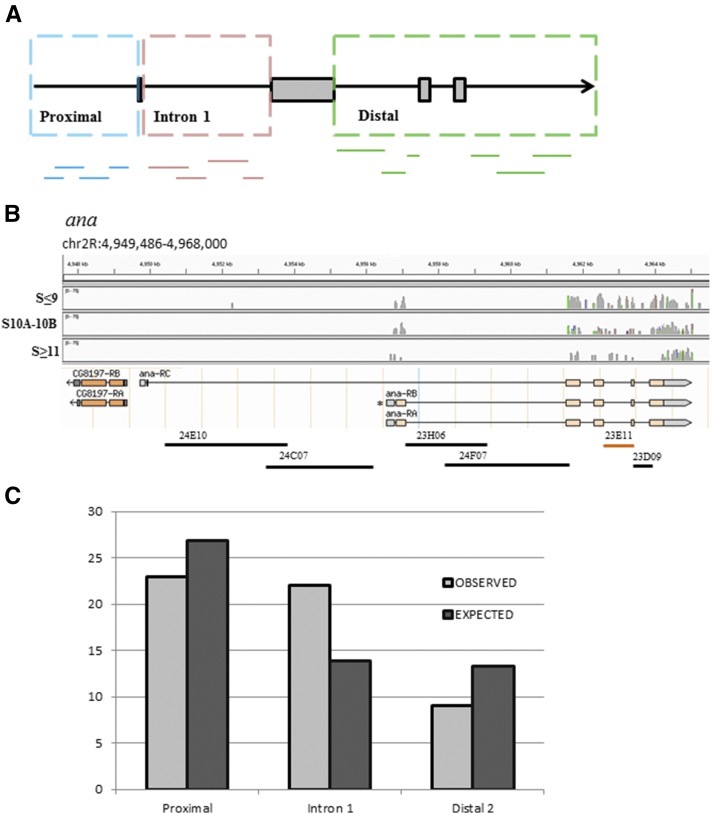
Figure 4.
(A) A cartoon representation of the gene-fragments’ binning that is based on the relative position of a fragment in the gene model. Proximal includes all fragments that are upstream to the first exon. Intron 1 includes all fragments that are in the first intron. Distal includes all fragments downstream of the second exon. (B) An example of one of the genes screened, ana, and its three isoforms. The gene has two “first” exons. Using RNA-seq data, we demonstrate in the coverage plot that the ana-RA and/or ana-RB isoforms (marked by *) are expressed during all stages of oogenesis, whereas ana-RC is not expressed. The RNA-seq data are divided into three developmental groups (stage 9 and younger, stages 10A and 10B, and stages 11 and older egg chambers). Peaks indicate the number of reads per base. Gray peaks indicate matched base pairs and colored peaks indicate mismatches (see Materials and Methods for details). The fragments mapped below the model were screened. The analysis shows that ana23E11 fragment (orange) is in the Distal bin. (C) A χ2 test shows that the GFP-expressing FlyLight fragments are distributed significantly different (P = 0.034, d.f. = 2) from the expected distribution.

