Figure 5.
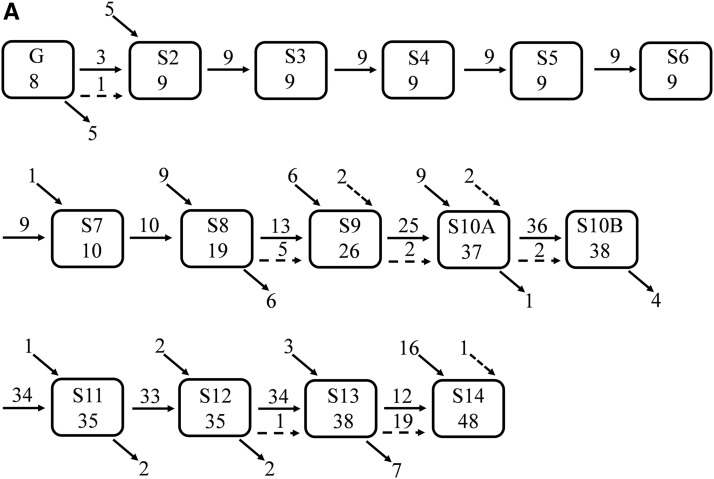
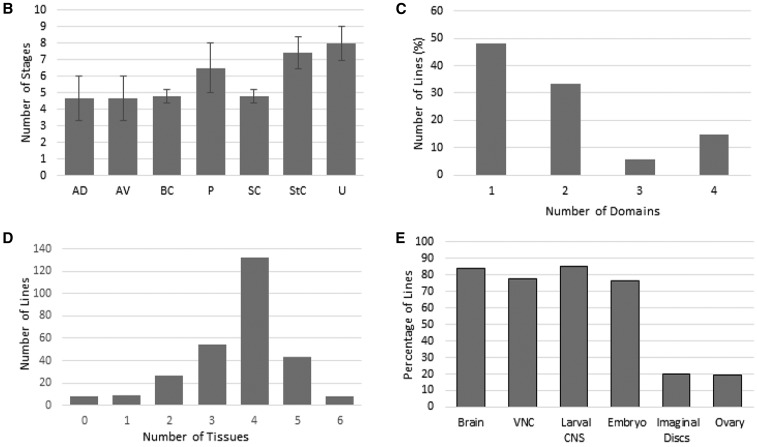
(A) A summary of the temporal distribution of GFP-positive FlyLight patterns throughout oogenesis. Each box represents a developmental stage and the number of lines expressing GFP. Horizontal arrows represent the number of lines with the same spatial pattern in the next developmental stage (referred to in the text as line patterns). Diagonal bottom arrows represent the number of lines not expressed in the next developmental stage. The diagonal top arrows represent the new lines expressed in this developmental stage. Horizontal broken arrows represent the number of lines expressed in the next developmental stage that change their spatial pattern. Diagonal broken arrows represent lines expressed in an early developmental stage, and now are expressed in a later developmental stage that is not the proximal stage (the pattern is spatially different from the earlier pattern). (B) For each domain, the average number of developmental stages it is expressed in and the SD were calculated. (C) For each of the GFP-positive FlyLight lines, the number of expression domains was calculated. The data are presented as percentage of the total lines expressing GFP for all developmental stages. (D) Based on the available data for the Flylight expression patterns, we determined the frequency of expression of each of the 281 lines in the five FlyLight tissues and oogenesis (total of six tissues). (E) Of the 281 lines screened, 84% are expressed in the brain, 78% in the ventral nerve cord, 85% in the larval CNS, 77% in the embryo, 20% in the third instar larvae imaginal discs, and 19% in the ovary.


