Figure 1.
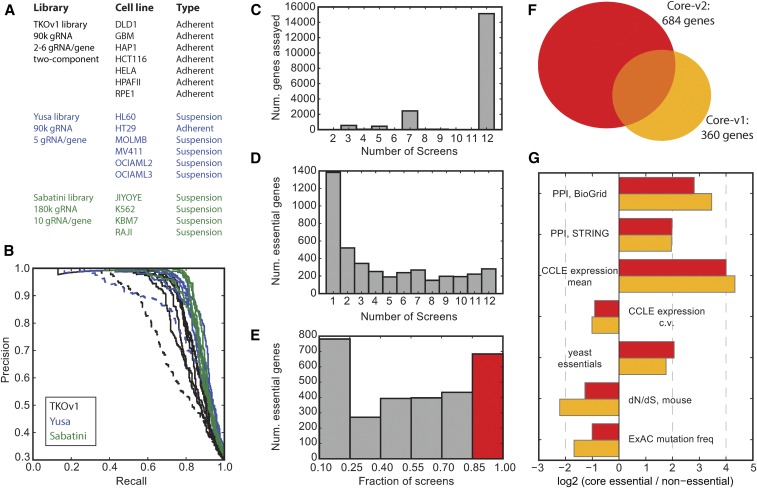
(A) List of CRISPR knockout screens used for this study. (B) Precision-recall curves for the screens in (A) using gold standards defined in Hart et al., 2014. Dashed lines represent low-performing screens that were excluded from further analysis. (C) Number of genes assayed by at least three gRNA per gene, across the 12 screens. (D) Number of genes classified as essential (BF ≥ 6, FDR ≤ 3%) across the 12 screens. (E) Fraction of screens in which a gene is classified as essential. Genes assayed in at least seven screens and essential in 85% of screens (red) are CEG2. (F) CEG2 (n = 684) is substantially larger and only overlaps CEG1 (n = 360; Hart et al. 2014) by ∼50%. (G) Functional characterization of CEG2 (Core-v2) vs. CEG1 (Core-v1).

