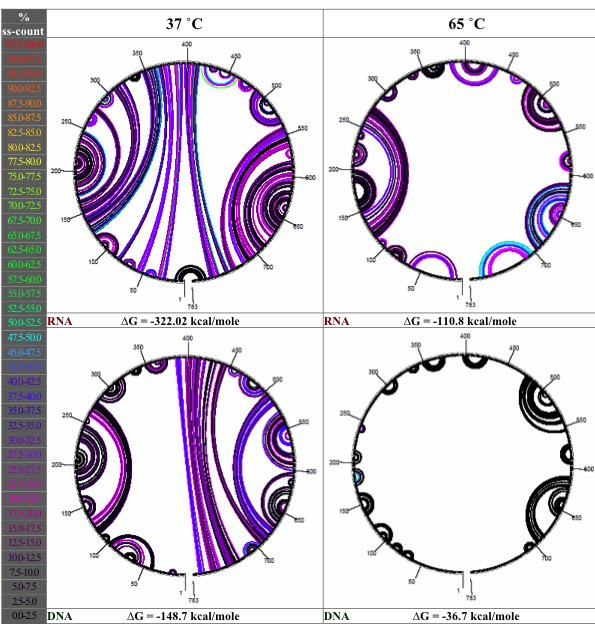
Figure 1.

Secondary structure in a sample transcript. Circular diagrams of structure in a sample transcript (moeB homolog designated BR0004) from Brucella suis. Circular diagrams show hydrogen bonds between individual nucleotides, color-coded according to single-strandedness – the fraction of structures in which that bond is not present. Black bonds indicate 0% single-strandedness; red bonds indicate 100% single-strandedness.
