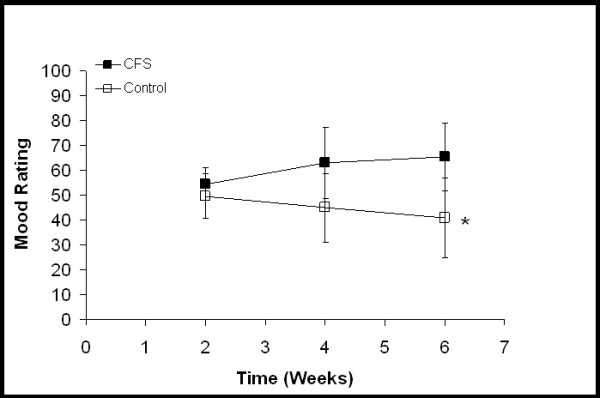
Figure 1.

Overall mood ratings. Each time point represents an average of the scores from the previous two weeks. "0" represents the best possible mood and "100" represents the worst mood imaginable. For CFS participants, the two week time point is from baseline activity and the four and six week time points are from increased activity. For control participants, all time points are from baseline activity. * Significant group × time interaction (P = 0.016). Values are mean ± SD.
