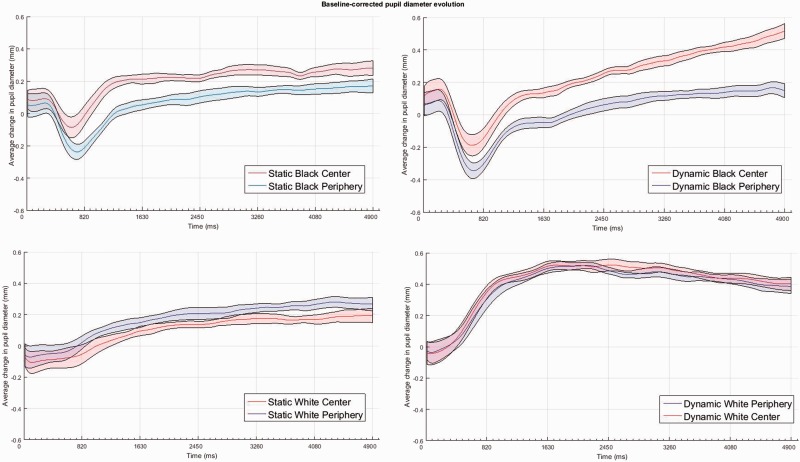
Figure 3.
Time series of mean pupil diameter (in mm) from onset to the end of the eye-tracking sequence, for either the static (left panel) and dynamic pattern types (right panel) and the white versus black patterns (top and bottom panels, respectively). The colored bands around the means (colored lines: red = center gradients; blue = periphery gradients) represent the 95% confidence intervals for within-subject design.

